1948 Central Shaneville Presidential election: Difference between revisions
No edit summary |
No edit summary |
||
| Line 27: | Line 27: | ||
| alliance1 = | | alliance1 = | ||
| leader_since1 = December 1936 | | leader_since1 = December 1936 | ||
| last_election1 = 7,246,020 (47.1%) | | last_election1 = ''7,246,020 (47.1%)'' | ||
| seats_before1 = 181 | | seats_before1 = ''181'' | ||
| seats1 = | | seats1 = ''103'' | ||
| seat_change1 = - | | seat_change1 = ''-78'' | ||
| popular_vote1 = | | popular_vote1 = ''3,315,499" | ||
| percentage1 = | | percentage1 = ''39.7%" | ||
| swing1 = - | | swing1 = - | ||
| Line 46: | Line 46: | ||
| last_election2 = 3,727,463 (24.1%) | | last_election2 = 3,727,463 (24.1%) | ||
| seats_before2 = 58 | | seats_before2 = 58 | ||
| seats2 = | | seats2 = 86 | ||
| seat_change2 = | | seat_change2 = +28 | ||
| popular_vote2 = | | popular_vote2 = 2,294,737 | ||
| percentage2 = | | percentage2 = 27.5% | ||
| swing2 = - | | swing2 = - | ||
| Line 62: | Line 62: | ||
| last_election3 = 3,524,840 (22.9%) | | last_election3 = 3,524,840 (22.9%) | ||
| seats_before3 = 15 | | seats_before3 = 15 | ||
| seats3 = | | seats3 = 54 | ||
| seat_change3 = | | seat_change3 = +39 | ||
| popular_vote3 = | | popular_vote3 = 2,189,423 | ||
| percentage3 = | | percentage3 = 26.2% | ||
| swing3 = - | | swing3 = - | ||
| Line 79: | Line 79: | ||
| last_election4 = 883,306 (5.7%) | | last_election4 = 883,306 (5.7%) | ||
| seats_before4 = 10 | | seats_before4 = 10 | ||
| seats4 = | | seats4 = 21 | ||
| seat_change4 = | | seat_change4 = +11 | ||
| popular_vote4 = | | popular_vote4 = 440,685 | ||
| percentage4 = | | percentage4 = 5.3% | ||
| swing4 = - | | swing4 = - | ||
| Line 99: | Line 99: | ||
As the campaign trail rolled on however, the Liberals seat predictions kept decreasing whilst the Conservatives under Lomax and New Democratic Party under MacMillan gained seats after the two parties unleashed attack advertising campaigns on incumbent President Banderas - with the Liberals in a tight race to keep their majority, Banderas decided to try and appeal to the younger voters of Central Shaneville by vouching for the importance of "family" whilst also claiming that if the Conservatives got back into power they would take food away from the people of Central Shaneville who need it in an attack campaign of his own. | As the campaign trail rolled on however, the Liberals seat predictions kept decreasing whilst the Conservatives under Lomax and New Democratic Party under MacMillan gained seats after the two parties unleashed attack advertising campaigns on incumbent President Banderas - with the Liberals in a tight race to keep their majority, Banderas decided to try and appeal to the younger voters of Central Shaneville by vouching for the importance of "family" whilst also claiming that if the Conservatives got back into power they would take food away from the people of Central Shaneville who need it in an attack campaign of his own. | ||
The results of the 1948 election sees the Liberals win a minority government in what was a major blow for the party as they lost their majority, incumbent President Louis Banderas wins a second term as President of Central Shaneville. | |||
Unlike the 1944 election, there was no voter count issues. | |||
==Exit Poll== | ==Exit Poll== | ||
| Line 151: | Line 155: | ||
! Of total | ! Of total | ||
! class="unsortable" | | ! class="unsortable" | | ||
|- | |- | ||
| style="text-align:left;" | Liberal Party | | style="text-align:left;" | Liberal Party | ||
| style="background:#ff0000;"| | | style="background:#ff0000;"| | ||
| style="text-align:left;" | <small>Louis Banderas <br> (incumbent)</small> | | style="text-align:left;" | <small>Louis Banderas <br> (incumbent)</small> | ||
| | | 103 | ||
| 0.0% | | 0.0% | ||
| {{composition bar| | | {{composition bar|103|264|hex=#ff0000}} | ||
| xxx | | xxx | ||
| | | 39.7%' | ||
| {{percentage bar| | | {{percentage bar|39.7|hex=ff0000}} | ||
|- | |- | ||
| style="text-align:left;" | New Democratic Party | | style="text-align:left;" | New Democratic Party | ||
| style="background:#FF6A00;"| | | style="background:#FF6A00;"| | ||
| style="text-align:left;" | <small>Margaret MacMillan</small> | | style="text-align:left;" | <small>Margaret MacMillan</small> | ||
| | | 86 | ||
| 0.0% | | 0.0% | ||
| {{composition bar| | | {{composition bar|86|264|hex=#FF6A00}} | ||
| xxx | | xxx | ||
| 27.5% | |||
| {{percentage bar|27.5|hex=FF6A00}} | |||
|- | |||
| style="text-align:left;" | Progressive Conservative Party | |||
| style="background:#0087dc"| | |||
| style="text-align:left;" | <small>Eric Lomax</small> | |||
| 54 | |||
| 0.0% | | 0.0% | ||
| {{percentage bar| | | {{composition bar|54|264|hex=#0087dc}} | ||
| xxx | |||
| 26.2% | |||
| {{percentage bar|26.2|hex=0087dc}} | |||
|- | |- | ||
| style="text-align:left;" | Social Credit Workers' Party | | style="text-align:left;" | Social Credit Workers' Party | ||
| style="background:"#116468;"| | | style="background:"#116468;"| | ||
| style="text-align:left;" | <small>John Foster</small> | | style="text-align:left;" | <small>John Foster</small> | ||
| | | 21 | ||
| 0.0% | | 0.0% | ||
| {{composition bar| | | {{composition bar|21|264|hex=#116468}} | ||
| xxx | | xxx | ||
| | | 5.3% | ||
| {{percentage bar| | | {{percentage bar|5.3|hex=116468}} | ||
|} | |} | ||
| Line 201: | Line 205: | ||
|barwidth=380px | |barwidth=380px | ||
|bars= | |bars= | ||
{{bar percent| | {{bar percent|Liberal Party|#ff0000|39.7}} | ||
{{bar percent| | {{bar percent|New Democratic Party|#FF6A00|27.5}} | ||
{{bar percent| | {{bar percent|Conservative Party|#0087dc|26.2}} | ||
{{bar percent|Social Credit Workers' Party|#116468| | {{bar percent|Social Credit Workers' Party|#116468|5.3}} | ||
}} | }} | ||
Revision as of 13:45, 13 November 2021
 | |||||||||||||||||||||||||||||||||||||||||||||||||||||||||||||||||||||||||||||||||||||||||
264 seats in the Central Shaneville Parliament (CSP) 133 seats needed for a majority | |||||||||||||||||||||||||||||||||||||||||||||||||||||||||||||||||||||||||||||||||||||||||
|---|---|---|---|---|---|---|---|---|---|---|---|---|---|---|---|---|---|---|---|---|---|---|---|---|---|---|---|---|---|---|---|---|---|---|---|---|---|---|---|---|---|---|---|---|---|---|---|---|---|---|---|---|---|---|---|---|---|---|---|---|---|---|---|---|---|---|---|---|---|---|---|---|---|---|---|---|---|---|---|---|---|---|---|---|---|---|---|---|---|
| Turnout | 75.7% | ||||||||||||||||||||||||||||||||||||||||||||||||||||||||||||||||||||||||||||||||||||||||
| |||||||||||||||||||||||||||||||||||||||||||||||||||||||||||||||||||||||||||||||||||||||||
| |||||||||||||||||||||||||||||||||||||||||||||||||||||||||||||||||||||||||||||||||||||||||
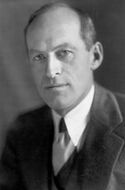
The 1948 Central Shaneville Presidential election was held on the 12 November 1948, Louis Banderas entered the election as the incumbent president.
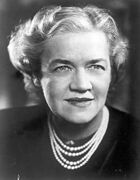
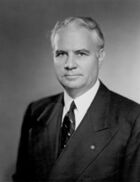
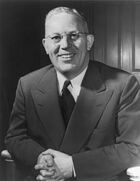
As the campaign trail rolled on however, the Liberals seat predictions kept decreasing whilst the Conservatives under Lomax and New Democratic Party under MacMillan gained seats after the two parties unleashed attack advertising campaigns on incumbent President Banderas - with the Liberals in a tight race to keep their majority, Banderas decided to try and appeal to the younger voters of Central Shaneville by vouching for the importance of "family" whilst also claiming that if the Conservatives got back into power they would take food away from the people of Central Shaneville who need it in an attack campaign of his own.
The results of the 1948 election sees the Liberals win a minority government in what was a major blow for the party as they lost their majority, incumbent President Louis Banderas wins a second term as President of Central Shaneville.
Unlike the 1944 election, there was no voter count issues.
Exit Poll
The Exit Poll took place a week before the election and predicted the following:
| Parties | Seats | Change | |
|---|---|---|---|
| Liberal Party | 105 | - | |
| Progressive Conservative Party | 65 | - | |
| New Democratic Party | 61 | - | |
| Social Credit Workers' Party | 20 | - | |
| Undecided | 13 | - | |
| LIBERAL PARTY WINS BUT FORMS A MINORITY GOVERNMENT. | |||
Results
After all electoral districts had been declared, the results were:
| Party | Leader | MLs | Votes | |||||
|---|---|---|---|---|---|---|---|---|
| Of total | Of total | |||||||
| Liberal Party | Louis Banderas (incumbent) |
103 | 0.0% | 103 / 264
|
xxx | 39.7%' | 39.7% | |
| New Democratic Party | Margaret MacMillan | 86 | 0.0% | 86 / 264
|
xxx | 27.5% | 27.5% | |
| Progressive Conservative Party | Eric Lomax | 54 | 0.0% | 54 / 264
|
xxx | 26.2% | 26.2% | |
| Social Credit Workers' Party | John Foster | 21 | 0.0% | 21 / 264
|
xxx | 5.3% | 5.3% | |


