List of Gylian regional elections
Jump to navigation
Jump to search


This is a list of Gylian regional elections. Regional elections take place every 4 years, for regional councils and a separate governor.
All figures sourced from Elections Gylias. They do not include invalid or blank votes.
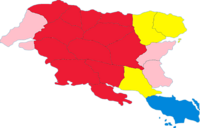
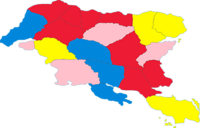
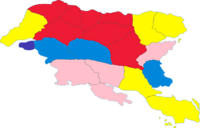
1970

Elected regional governors, coloured by political affiliation
Statist left
Non-inscrit left
Centre-left
Liberal
Centre
Centre-right
ARENA
Statist left
Non-inscrit left
Centre-left
Liberal
Centre
Centre-right
ARENA
| Parties and blocs | FPV | % | ± | |
|---|---|---|---|---|
| National Bloc | 880.599 | 15,1% | New | |
| Progressive Alliance | 839.777 | 14,4% | New | |
| Liberal Union | 583.178 | 10,0% | New | |
| Centre Group | 519.029 | 8,9% | New | |
| Revolutionary Rally | 139.963 | 2,4% | New | |
| Front for Renewal of Order and Society | 11.664 | 0,2% | New | |
| Regional parties and independents | 1.673.722 | 28,7% | New | |
| Non-inscrits and independents | 1.183.852 | 20,3% | New | |
| Total | 5.831.785 | 100% | — | |
| Registered voters and turnout | 6.284.251 | 92,8% | New | |
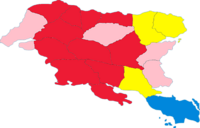
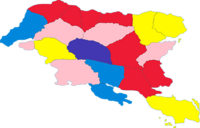
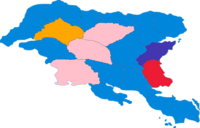
1974

Elected regional governors, coloured by political affiliation
Statist left
Non-inscrit left
Centre-left
Liberal
Centre
Centre-right
ARENA
Statist left
Non-inscrit left
Centre-left
Liberal
Centre
Centre-right
ARENA
| Parties and blocs | FPV | % | ± | |
|---|---|---|---|---|
| National Bloc | 1.028.160 | 15,5% | ||
| Progressive Alliance | 941.928 | 14,2% | ||
| Liberal Union | 669.963 | 10,1% | ||
| Centre Group | 583.730 | 8,8% | ||
| Revolutionary Rally | 139.299 | 2,1% | ||
| Front for Renewal of Order and Society | 13.267 | 0,2% | ||
| Regional parties and independents | 1.890.489 | 28,5% | ||
| Non-inscrits and independents | 1.366.458 | 20,6% | ||
| Total | 6.633.293 | 100% | — | |
| Registered voters and turnout | 7.121.088 | 93,2% | ||
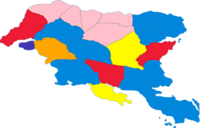
1978

Elected regional governors, coloured by political affiliation
Statist left
Non-inscrit left
Centre-left
Liberal
Centre
Centre-right
ARENA
Statist left
Non-inscrit left
Centre-left
Liberal
Centre
Centre-right
ARENA
| Parties and blocs | FPV | % | ± | |
|---|---|---|---|---|
| National Bloc | 1.391.309 | 18,5% | ||
| Progressive Alliance | 834.785 | 11,1% | ||
| Liberal Union | 661.812 | 8,8% | ||
| Centre Group | 586.606 | 7,8% | ||
| Revolutionary Rally | 406.112 | 5,4% | ||
| Front for Renewal of Order and Society | 90.247 | 1,2% | ||
| Regional parties and independents | 2.038.080 | 27,1% | ||
| Non-inscrits and independents | 1.697.923 | 20,3% | ||
| Total | 7.520.589 | 100% | — | |
| Registered voters and turnout | 7.937.297 | 94,8% | ||
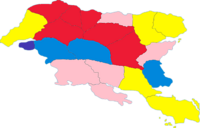
1982

Elected regional governors, coloured by political affiliation
Statist left
Non-inscrit left
Centre-left
Liberal
Centre
Centre-right
ARENA
Statist left
Non-inscrit left
Centre-left
Liberal
Centre
Centre-right
ARENA
| Parties and blocs | FPV | % | ± | |
|---|---|---|---|---|
| National Bloc | 1.555.733 | 18,6% | ||
| Progressive Alliance | 970.242 | 11,6% | ||
| Liberal Union | 702.589 | 8,4% | ||
| Centre Group | 627.312 | 7,5% | ||
| Revolutionary Rally | 434.936 | 5,2% | ||
| Front for Renewal of Order and Society | 125.462 | 1,5% | ||
| Regional parties and independents | 2.249.957 | 26,9% | ||
| Non-inscrits and independents | 1.697.923 | 20,3% | ||
| Total | 8.364.154 | 100% | — | |
| Registered voters and turnout | 8.869.729 | 94,3% | ||
1986

Elected regional governors, coloured by political affiliation
Statist left
Non-inscrit left
Centre-left
Liberal
Centre
Centre-right
ARENA
Statist left
Non-inscrit left
Centre-left
Liberal
Centre
Centre-right
ARENA
| Parties and blocs | FPV | % | ± | |
|---|---|---|---|---|
| National Bloc | 1.750.754 | 19,2% | ||
| Progressive Alliance | 1.048.629 | 11,5% | ||
| Liberal Union | 729.481 | 8,0% | ||
| Centre Group | 720.362 | 7,9% | ||
| Revolutionary Rally | 428.570 | 4,7% | ||
| Front for Renewal of Order and Society | 155.015 | 1,7% | ||
| Regional parties and independents | 2.416.405 | 26,5% | ||
| Non-inscrits and independents | 1.869.294 | 20,5% | ||
| Total | 9.118.509 | 100% | — | |
| Registered voters and turnout | 9.619.695 | 94,8% | ||
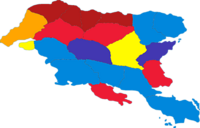
1990

Elected regional governors, coloured by political affiliation
Statist left
Non-inscrit left
Centre-left
Liberal
Centre
Centre-right
ARENA
Statist left
Non-inscrit left
Centre-left
Liberal
Centre
Centre-right
ARENA
| Parties and blocs | FPV | % | ± | |
|---|---|---|---|---|
| Progressive Alliance | 1.344.610 | 13,7% | ||
| Liberal Union | 1.099.243 | 11,2% | ||
| National Bloc | 1.050.169 | 10,7% | ||
| Centre Group | 942.208 | 9,6% | ||
| Union for Freedom and Prosperity | 107.961 | 1,1% | New | |
| Revolutionary Rally | 49.073 | 0,5% | ||
| Front for Renewal of Order and Society | 29.444 | 0,3% | ||
| Regional parties and independents | 2.689.219 | 27,4% | ||
| Non-inscrits and independents | 2.502.740 | 25,5% | ||
| Total | 9.814.668 | 100% | — | |
| Registered voters and turnout | 10.331.230 | 95,0% | ||
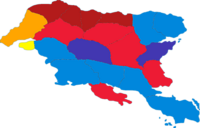
1994

Elected regional governors, coloured by political affiliation
Statist left
Non-inscrit left
Centre-left
Liberal
Centre
Centre-right
ARENA
Statist left
Non-inscrit left
Centre-left
Liberal
Centre
Centre-right
ARENA
| Parties and blocs | FPV | % | ± | |
|---|---|---|---|---|
| Progressive Alliance | 1.442.864 | 13,6% | ||
| Liberal Union | 1.145.803 | 10,8% | ||
| National Bloc | 1.124.585 | 10,6% | ||
| Centre Group | 1.039.711 | 9,8% | ||
| Union for Freedom and Prosperity | 106.093 | 1,0% | ||
| Revolutionary Rally | 53.046 | 0,5% | ||
| Front for Renewal of Order and Society | 21.219 | 0,2% | ||
| Regional parties and independents | 2.938.774 | 27,7% | ||
| Non-inscrits and independents | 2.737.197 | 25,8% | ||
| Total | 10.609.291 | 100% | — | |
| Registered voters and turnout | 11.226.763 | 94,5% | ||
1998

Elected regional governors, coloured by political affiliation
Statist left
Non-inscrit left
Centre-left
Liberal
Centre
Centre-right
ARENA
Statist left
Non-inscrit left
Centre-left
Liberal
Centre
Centre-right
ARENA
| Parties and blocs | FPV | % | ± | |
|---|---|---|---|---|
| Progressive Alliance | 1.531.754 | 13,2% | ||
| Liberal Union | 1.276.462 | 11,0% | ||
| National Bloc | 1.241.649 | 10,7% | ||
| Centre Group | 1.090.795 | 9,4% | ||
| Union for Freedom and Prosperity | 104.438 | 0,9% | ||
| Revolutionary Rally | 58.021 | 0,5% | ||
| Front for Renewal of Order and Society | 23.208 | 0,2% | ||
| Regional parties and independents | 3.249.175 | 28,0% | ||
| Non-inscrits and independents | 3.028.695 | 26,1% | ||
| Total | 11.604.197 | 100% | — | |
| Registered voters and turnout | 12.271.782 | 94,6% | ||
2002

Elected regional governors, coloured by political affiliation
Statist left
Non-inscrit left
Centre-left
Liberal
Centre
Centre-right
ARENA
Statist left
Non-inscrit left
Centre-left
Liberal
Centre
Centre-right
ARENA
| Parties and blocs | FPV | % | ± | |
|---|---|---|---|---|
| Progressive Alliance | 1.742.880 | 13,6% | ||
| National Bloc | 1.499.389 | 11,7% | ||
| Liberal Union | 1.281.529 | 10,0% | ||
| Centre Group | 1.204.637 | 9,4% | ||
| Union for Freedom and Prosperity | 102.522 | 0,8% | ||
| Revolutionary Rally | 51.261 | 0,4% | ||
| Front for Renewal of Order and Society | 25.631 | 0,2% | ||
| Regional parties and independents | 3.613.912 | 28,2% | ||
| Non-inscrits and independents | 3.293.530 | 25,7% | ||
| Total | 12.815.291 | 100% | — | |
| Registered voters and turnout | 13.486.940 | 95,0% | ||
2006

Elected regional governors, coloured by political affiliation
Statist left
Non-inscrit left
Centre-left
Liberal
Centre
Centre-right
ARENA
Statist left
Non-inscrit left
Centre-left
Liberal
Centre
Centre-right
ARENA
| Parties and blocs | FPV | % | ± | |
|---|---|---|---|---|
| Progressive Alliance | 1.899.523 | 13,5% | ||
| National Bloc | 1.716.606 | 12,2% | ||
| Centre Group | 1.392.983 | 9,9% | ||
| Liberal Union | 1.378.913 | 9,8% | ||
| Union for Freedom and Prosperity | 112.564 | 0,8% | ||
| Revolutionary Rally | 56.282 | 0,4% | ||
| Front for Renewal of Order and Society | 14.071 | 0,1% | ||
| Regional parties and independents | 3.925.681 | 27,9% | ||
| Non-inscrits and independents | 3.573.917 | 25,4% | ||
| Total | 14.070.540 | 100% | — | |
| Registered voters and turnout | 14.713.521 | 95,6% | ||
2010

Elected regional governors, coloured by political affiliation
Statist left
Non-inscrit left
Centre-left
Liberal
Centre
Centre-right
ARENA
Statist left
Non-inscrit left
Centre-left
Liberal
Centre
Centre-right
ARENA
| Parties and blocs | FPV | % | ± | |
|---|---|---|---|---|
| Progressive Alliance | 2.072.488 | 13,4% | ||
| National Bloc | 1.933.291 | 12,5% | ||
| Centre Group | 1.623.964 | 10,5% | ||
| Liberal Union | 1.453.835 | 9,4% | ||
| Union for Freedom and Prosperity | 123.731 | 0,8% | ||
| Revolutionary Rally | 46.399 | 0,3% | ||
| Front for Renewal of Order and Society | 15.466 | 0,1% | ||
| Regional parties and independents | 4.284.172 | 27,7% | ||
| Non-inscrits and independents | 3.912.981 | 25,3% | ||
| Total | 15.466.327 | 100% | — | |
| Registered voters and turnout | 16.146.076 | 95,8% | ||
2014

Elected regional governors, coloured by political affiliation
Statist left
Non-inscrit left
Centre-left
Liberal
Centre
Centre-right
ARENA
Statist left
Non-inscrit left
Centre-left
Liberal
Centre
Centre-right
ARENA
| Parties and blocs | FPV | % | ± | |
|---|---|---|---|---|
| National Bloc | 2.217.435 | 13,0% | ||
| Progressive Alliance | 2.183.320 | 12,8% | ||
| Centre Group | 1.876.291 | 11,0% | ||
| Liberal Union | 1.569.262 | 9,2% | ||
| Union for Freedom and Prosperity | 119.400 | 0,7% | ||
| Revolutionary Rally | 51.172 | 0,3% | ||
| Front for Renewal of Order and Society | 17.057 | 0,1% | ||
| Regional parties and independents | 4.793.070 | 28,1% | ||
| Non-inscrits and independents | 4.230.183 | 24,8% | ||
| Total | 17.057.190 | 100% | — | |
| Registered voters and turnout | 17.718.074 | 96,3% | ||
2018

Elected regional governors, coloured by political affiliation
Statist left
Non-inscrit left
Centre-left
Liberal
Centre
Centre-right
ARENA
Statist left
Non-inscrit left
Centre-left
Liberal
Centre
Centre-right
ARENA
| Parties and blocs | FPV | % | ± | |
|---|---|---|---|---|
| National Bloc | 2.677.996 | 14,4% | ||
| Progressive Alliance | 2.454.830 | 13,2% | ||
| Centre Group | 1.841.122 | 9,9% | ||
| Liberal Union | 1.506.373 | 8,1% | ||
| Union for Freedom and Prosperity | 130.180 | 0,7% | ||
| Revolutionary Rally | 55.792 | 0,3% | ||
| Front for Renewal of Order and Society | 18.597 | 0,1% | ||
| Regional parties and independents | 5.263.006 | 28,3% | ||
| Non-inscrits and independents | 4.649.299 | 25,0% | ||
| Total | 18.597.195 | 100% | — | |
| Registered voters and turnout | 19.444.996 | 95,6% | ||
2022

Elected regional governors, coloured by political affiliation
Statist left
Non-inscrit left
Centre-left
Liberal
Centre
Centre-right
ARENA
Statist left
Non-inscrit left
Centre-left
Liberal
Centre
Centre-right
ARENA
| Parties and blocs | FPV | % | ± | |
|---|---|---|---|---|
| National Bloc | 3.221.430 | 16,0% | ||
| Progressive Alliance | 2.496.609 | 12,4% | ||
| Centre Group | 2.053.662 | 10,2% | ||
| Liberal Union | 1.550.313 | 7,7% | ||
| Union for Freedom and Prosperity | 120.804 | 0,6% | ||
| Revolutionary Rally | 60.402 | 0,3% | ||
| Front for Renewal of Order and Society | 20.134 | 0,1% | ||
| Regional parties and independents | 5.536.833 | 27,5% | ||
| Non-inscrits and independents | 5.073.753 | 25,2% | ||
| Total | 20.133.940 | 100% | — | |
| Registered voters and turnout | 21.149.096 | 95,2% | ||