1966 Elizean general election: Difference between revisions
Jump to navigation
Jump to search
No edit summary |
No edit summary |
||
| Line 94: | Line 94: | ||
=== Results === | === Results === | ||
{{Election results | {{Election results | ||
|party1= | |party1=Social Democrats|votes1=4323976|seats1=176|sc1=+31|color1=#DC143C | ||
|party2=[[People's Party of Elizea and the Frisian Regions|People's Party]] {{efn|The national People's Party participates in Elizea and in the Frisian Regions under the Esperanto name: ''Popola Partio''}}|votes2=3967566|seats2=140|sc2=-27|color2=#4169E1 | |party2=[[People's Party of Elizea and the Frisian Regions|People's Party]] {{efn|The national People's Party participates in Elizea and in the Frisian Regions under the Esperanto name: ''Popola Partio''}}|votes2=3967566|seats2=140|sc2=-27|color2=#4169E1 | ||
|party3=Radical Party|votes3=504459|seats3=17|sc3=-7|color3=#90EE90 | |party3=Radical Party|votes3=504459|seats3=17|sc3=-7|color3=#90EE90 | ||
Revision as of 00:33, 13 September 2023
| |||||||||||||||||||||||||||||||||||||||||||||||||||||||||||||||||||||||||||||
All 360 seats to the Parliament 181 seats needed for a majority | |||||||||||||||||||||||||||||||||||||||||||||||||||||||||||||||||||||||||||||
|---|---|---|---|---|---|---|---|---|---|---|---|---|---|---|---|---|---|---|---|---|---|---|---|---|---|---|---|---|---|---|---|---|---|---|---|---|---|---|---|---|---|---|---|---|---|---|---|---|---|---|---|---|---|---|---|---|---|---|---|---|---|---|---|---|---|---|---|---|---|---|---|---|---|---|---|---|---|
| Opinion polls | |||||||||||||||||||||||||||||||||||||||||||||||||||||||||||||||||||||||||||||
| Turnout | 84.58% | ||||||||||||||||||||||||||||||||||||||||||||||||||||||||||||||||||||||||||||
| |||||||||||||||||||||||||||||||||||||||||||||||||||||||||||||||||||||||||||||
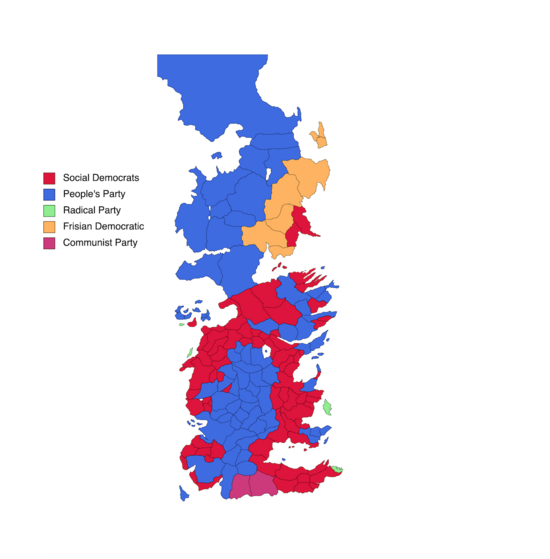
 Map of Elizea districts won | |||||||||||||||||||||||||||||||||||||||||||||||||||||||||||||||||||||||||||||
Results
| Party | Votes | % | Seats | +/– | |
|---|---|---|---|---|---|
| Social Democrats | 4,323,976 | 42.50 | 176 | +31 | |
| People's Party [a] | 3,967,566 | 38.99 | 140 | -27 | |
| Radical Party | 504,459 | 4.96 | 17 | -7 | |
| Frisian Democratic Union | 374,033 | 3.68 | 13 | +7 | |
| Communist Party | 307,645 | 3.02 | 10 | -1 | |
| Independent Liberals | 265,087 | 2.61 | 0 | New | |
| Nationalist Union | 200,234 | 1.97 | 0 | – | |
| People's Party [b] | 84,612 | 0.83 | 3 | -3 | |
| Communist Party - Stalinist | 44,359 | 0.44 | 0 | – | |
| Frisian Voters' Association | 35,211 | 0.35 | 1 | – | |
| others | 68,003 | 0.67 | 0 | – | |
| Total | 10,175,185 | 100.00 | 360 | 0 | |
| Valid votes | 10,175,185 | 99.92 | |||
| Invalid/blank votes | 8,023 | 0.08 | |||
| Total votes | 10,183,208 | 100.00 | |||
| Registered voters/turnout | 12,039,026 | 84.58 | |||


