Sandbox/UK/17: Difference between revisions
Jump to navigation
Jump to search
(Created page with "{{Infobox election | election_name = 2017 United Kingdom general election | country = United Kingdom | type = parliamentary | ongoing = no | previous_election = 2015 United Kingdom general election | previous_year = 2015 | election_date = 8 June 2017 | next_election = 2019 United Kingdom general election | next_year = 2019 | previous_mps = List of MPs elected in the 2015 United Kingdom general election | next_mps = | elected_mps = List of MPs elected in the 2017 United...") |
No edit summary |
||
| (2 intermediate revisions by the same user not shown) | |||
| Line 7: | Line 7: | ||
| previous_year = 2015 | | previous_year = 2015 | ||
| election_date = 8 June 2017 | | election_date = 8 June 2017 | ||
| next_election = | | next_election = 2022 United Kingdom general election | ||
| next_year = | | next_year = 2022 | ||
| previous_mps = List of MPs elected in the 2015 United Kingdom general election | | previous_mps = List of MPs elected in the 2015 United Kingdom general election | ||
| next_mps = | | next_mps = | ||
| Line 14: | Line 14: | ||
| seats_for_election = All {{wp|Constituencies of the Parliament of the United Kingdom|650 seats}} in the {{wp|House of Commons of the United Kingdom|House of Commons}} | | seats_for_election = All {{wp|Constituencies of the Parliament of the United Kingdom|650 seats}} in the {{wp|House of Commons of the United Kingdom|House of Commons}} | ||
| majority_seats = 326{{refn|group=n|name=realmajority|Given that Sinn Féin MPs {{wp|Abstentionism#Sinn Féin|do not take their seats}} and the Speaker and deputies do not vote, the number of MPs needed for a majority is, in practice, slightly lower. Sinn Féin won 7 seats, meaning a practical majority requires at least 320 MPs.}} | | majority_seats = 326{{refn|group=n|name=realmajority|Given that Sinn Féin MPs {{wp|Abstentionism#Sinn Féin|do not take their seats}} and the Speaker and deputies do not vote, the number of MPs needed for a majority is, in practice, slightly lower. Sinn Féin won 7 seats, meaning a practical majority requires at least 320 MPs.}} | ||
| opinion_polls = Opinion polling for the | | opinion_polls = Opinion polling for the 2019 United Kingdom general election | ||
| turnout = 32,204,184<br>68.8% ({{increase}} 2.4 {{wp|Percentage point|pp}})<ref>{{cite web |title=General Election 2017: full results and analysis |url=http://researchbriefings.parliament.uk/ResearchBriefing/Summary/CBP-7979#fullreport |website=UK Parliament |edition=second |date=29 January 2019 |access-date=6 April 2022 |archive-date=16 November 2019 |archive-url=https://web.archive.org/web/20191116202815/https://researchbriefings.parliament.uk/ResearchBriefing/Summary/CBP-7979#fullreport |url-status=live }}</ref> | | turnout = 32,204,184<br>68.8% ({{increase}} 2.4 {{wp|Percentage point|pp}})<ref>{{cite web |title=General Election 2017: full results and analysis |url=http://researchbriefings.parliament.uk/ResearchBriefing/Summary/CBP-7979#fullreport |website=UK Parliament |edition=second |date=29 January 2019 |access-date=6 April 2022 |archive-date=16 November 2019 |archive-url=https://web.archive.org/web/20191116202815/https://researchbriefings.parliament.uk/ResearchBriefing/Summary/CBP-7979#fullreport |url-status=live }}</ref> | ||
| registered = 46,836,533 | | registered = 46,836,533 | ||
| Line 23: | Line 23: | ||
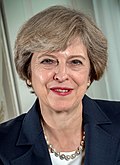
| leaders_seat1 = {{wp|Maidenhead (UK Parliament constituency)|Maidenhead}} | | leaders_seat1 = {{wp|Maidenhead (UK Parliament constituency)|Maidenhead}} | ||
| last_election1 = 330 seats, 36.9% | | last_election1 = 330 seats, 36.9% | ||
| seats1 = ''' | | seats1 = '''446''' | ||
| seat_change1 = {{ | | seat_change1 = {{increase}} 116 | ||
| popular_vote1 = ''' | | popular_vote1 = '''15,232,579''' | ||
| percentage1 = ''' | | percentage1 = '''47.3%''' | ||
| swing1 = {{increase}} | | swing1 = {{increase}} 10.5 {{wp|Percentage point|pp}} | ||
<!-- Labour -->| image2 = {{CSS image crop|Image =Jeremy Corbyn election infobox 2.jpg|bSize = 120|cWidth = 120|cHeight = 160|oTop = 0|oLeft = 0}} | <!-- Labour -->| image2 = {{CSS image crop|Image =Jeremy Corbyn election infobox 2.jpg|bSize = 120|cWidth = 120|cHeight = 160|oTop = 0|oLeft = 0}} | ||
| leader2 = {{wp|Jeremy Corbyn}} | | leader2 = {{wp|Jeremy Corbyn}} | ||
| Line 34: | Line 34: | ||
| leaders_seat2 = {{wp|Islington North}} | | leaders_seat2 = {{wp|Islington North}} | ||
| last_election2 = 232 seats, 30.4% | | last_election2 = 232 seats, 30.4% | ||
| seats2 = | | seats2 = 130 | ||
| seat_change2 = {{ | | seat_change2 = {{decrease}} 102 <!--comparison is with last election --> | ||
| popular_vote2 = | | popular_vote2 = 9,693,459 | ||
| percentage2 = | | percentage2 = 30.1% | ||
| | | swing2 = {{decrease}} 0.3 {{wp|Percentage point|pp}} | ||
<!-- SNP -->| | <!-- Lib Dem -->| image3 = {{CSS image crop|Image =Official portrait of Tim Farron MP crop 4.jpg|bSize = 120|cWidth = 120|cHeight = 160|oTop = 0|oLeft = 0}} | ||
| | | leader3 = {{wp|Tim Farron}} | ||
| | | leader_since3 = {{wp|2015 Liberal Democrats leadership election|16 July 2015}} | ||
| | | party3 = Liberal Democrats (UK) | ||
| | | leaders_seat3 = {{wp|Westmorland and Lonsdale (UK Parliament constituency)|Westmorland<br />and Lonsdale}} | ||
| | | popular_vote3 = 3,993,318 | ||
| | | percentage3 = 12.4% | ||
| | | swing3 = {{increase}} 4.5 {{wp|Percentage point|pp}} | ||
| | | last_election3 = 8 seats, 7.9% | ||
| | | seats3 = 20 | ||
| | | seat_change3 = {{increase}} 12<!-- comparison is with last election --> | ||
<!-- SNP -->| image4 = {{CSS image crop|Image =Nicola Sturgeon election infobox 3.jpg|bSize = 120|cWidth = 120|cHeight = 160|oTop = 0|oLeft = 0}} | |||
| leader4 = {{wp|Nicola Sturgeon}} | |||
| leader_since4 = {{wp|2014 Scottish National Party leadership election|14 November 2014}} | |||
| party4 = Scottish National Party | |||
| leaders_seat4 = ''Did not stand''{{refn|group=n|name=sturgeonseat|Nicola Sturgeon sits as an {{wp|Member of the Scottish Parliament|MSP}} in the {{wp|Scottish Parliament}} for {{wp|Glasgow Southside}}. Before the election, the SNP delegation to the House of Commons was led by {{wp|Angus Robertson}}, MP for {{wp|Moray (UK Parliament constituency)|Moray}}, who lost his seat. {{wp|Ian Blackford}}, MP for {{wp|Ross, Skye and Lochaber (UK Parliament constituency)|Ross, Skye and Lochaber}}, succeeded him.}} | |||
| last_election4 = 56 seats, 4.7% | |||
| seats4 = 34 | |||
| seat_change4 = {{decrease}} 22<!-- comparison is with last election --> | |||
| popular_vote4 = 977,568 | |||
| percentage4 = 3.0% | |||
| swing4 = {{decrease}} 1.7 {{wp|Percentage point|pp}} | |||
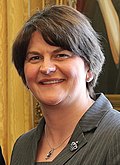
<!-- DUP -->| image5 = {{CSS image crop|Image =Arlene Foster election infobox.jpg|bSize = 120|cWidth = 120|cHeight = 160|oTop = 0|oLeft = 0}} | <!-- DUP -->| image5 = {{CSS image crop|Image =Arlene Foster election infobox.jpg|bSize = 120|cWidth = 120|cHeight = 160|oTop = 0|oLeft = 0}} | ||
| leader5 = {{wp|Arlene Foster}} | | leader5 = {{wp|Arlene Foster}} | ||
Latest revision as of 18:12, 23 December 2024
| |||||||||||||||||||||||||||||||||||||||||||||||||||||||||||||||||||||||||||||||||||||||||||||
All 650 seats in the House of Commons 326[n 1] seats needed for a majority | |||||||||||||||||||||||||||||||||||||||||||||||||||||||||||||||||||||||||||||||||||||||||||||
|---|---|---|---|---|---|---|---|---|---|---|---|---|---|---|---|---|---|---|---|---|---|---|---|---|---|---|---|---|---|---|---|---|---|---|---|---|---|---|---|---|---|---|---|---|---|---|---|---|---|---|---|---|---|---|---|---|---|---|---|---|---|---|---|---|---|---|---|---|---|---|---|---|---|---|---|---|---|---|---|---|---|---|---|---|---|---|---|---|---|---|---|---|---|
| Opinion polls | |||||||||||||||||||||||||||||||||||||||||||||||||||||||||||||||||||||||||||||||||||||||||||||
| Registered | 46,836,533 | ||||||||||||||||||||||||||||||||||||||||||||||||||||||||||||||||||||||||||||||||||||||||||||
| Turnout | 32,204,184 68.8% ( | ||||||||||||||||||||||||||||||||||||||||||||||||||||||||||||||||||||||||||||||||||||||||||||
| |||||||||||||||||||||||||||||||||||||||||||||||||||||||||||||||||||||||||||||||||||||||||||||
A map of UK parliamentary constituencies, with each winner's constituency, percentage of victory. | |||||||||||||||||||||||||||||||||||||||||||||||||||||||||||||||||||||||||||||||||||||||||||||
Composition of the House of Commons after the election | |||||||||||||||||||||||||||||||||||||||||||||||||||||||||||||||||||||||||||||||||||||||||||||
| |||||||||||||||||||||||||||||||||||||||||||||||||||||||||||||||||||||||||||||||||||||||||||||
Cite error: <ref> tags exist for a group named "n", but no corresponding <references group="n"/> tag was found
- ↑ "General Election 2017: full results and analysis". UK Parliament (second ed.). 29 January 2019. Archived from the original on 16 November 2019. Retrieved 6 April 2022.


