OOC:Sarenium: Difference between revisions
Jump to navigation
Jump to search
mNo edit summary |
m (→Close states) |
||
| (4 intermediate revisions by the same user not shown) | |||
| Line 18: | Line 18: | ||
| nominee1 = '''{{font color|#0645AD|Amanda Kallman}}''' | | nominee1 = '''{{font color|#0645AD|Amanda Kallman}}''' | ||
| party1 = Republican Party (United States) | | party1 = Republican Party (United States) | ||
| home_state1 = {{font color|Utah}} | | home_state1 = {{font color|#0645AD|Utah}} | ||
| running_mate1 = '''{{font color|Crawford Clay}}''' | | running_mate1 = '''{{font color|#0645AD|Crawford Clay}}''' | ||
| electoral_vote1 = '''283''' | | electoral_vote1 = '''283''' | ||
| states_carried1 = '''30 + ME-02''' | | states_carried1 = '''30 + ME-02''' | ||
| popular_vote1 = 73,881,153 | | popular_vote1 = '''73,881,153''' | ||
| percentage1 = {{percentage|<!-- TRUMP: --> 73,881,153|<!-- TOTAL: --> 153,993,186|1|pad=yes}} | | percentage1 = '''{{percentage|<!-- TRUMP: --> 73,881,153|<!-- TOTAL: --> 153,993,186|1|pad=yes}}''' | ||
| image2 = 2018ab0278.jpg <!-- Please don't change infobox images without first discussing on the talk page. --> | | image2 = 2018ab0278.jpg <!-- Please don't change infobox images without first discussing on the talk page. --> | ||
| nominee2 = {{font color|Frank McCreary}} | | nominee2 = {{font color|#0645AD|Frank McCreary}} | ||
| party2 = Democratic Party (United States)<!-- Please see talk page for consensus on party order on first row. --> | | party2 = Democratic Party (United States)<!-- Please see talk page for consensus on party order on first row. --> | ||
| home_state2 = {{font color|Delaware}} | | home_state2 = {{font color|#0645AD|Delaware}} | ||
| running_mate2 = {{font color|Carmen Sarelli-Sainz}} | | running_mate2 = {{font color|#0645AD|Carmen Sarelli-Sainz}} | ||
| electoral_vote2 = 255 | | electoral_vote2 = 255 | ||
| states_carried2 = 20 + {{font color|DC}} | | states_carried2 = 20 + {{font color|#0645AD|DC}} | ||
| popular_vote2 = | | popular_vote2 = 73,593,128 | ||
| percentage2 = | | percentage2 = {{percentage|<!-- CLINTON: --> 73,593,128|<!-- TOTAL: --> 153,993,186|1|pad=yes}} | ||
| map_size = 350px | | map_size = 350px | ||
| map = [[File:Kallman W.png|300px]] | | map = [[File:Kallman W.png|300px]] | ||
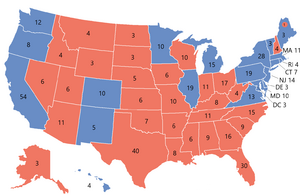
| map_caption = Presidential election results map. <span style="color:darkred;">Red</span> denotes states won by Kallman/Clay and <span style="color:darkblue;">blue</span> denotes those won by McCreary/Sarelli-Sainz. Numbers indicate [[United States Electoral College|electoral votes]] cast by each state and the District of Columbia. On election night, Kallman won 283 electors and McCreary 255. | | map_caption = Presidential election results map. <span style="color:darkred;">Red</span> denotes states won by Kallman/Clay and <span style="color:darkblue;">blue</span> denotes those won by McCreary/Sarelli-Sainz. Numbers indicate [[United States Electoral College|electoral votes]] cast by each state and the District of Columbia. On election night, Kallman won 283 electors and McCreary 255. | ||
| title = President | | title = President | ||
| before_election = {{font color|Indira Clarke}} | | before_election = {{font color|#0645AD|Indira Clarke}} | ||
| before_party = Democratic Party (United States) | | before_party = Democratic Party (United States) | ||
| after_election = {{font color|Amanda Kallman}} | | after_election = {{font color|#0645AD|Amanda Kallman}} | ||
| after_party = Republican Party (United States) | | after_party = Republican Party (United States) | ||
}} | }} | ||
{{clear}} | |||
===Close states=== | |||
States where the margin of victory was under 1% (33 electoral votes; 19 won by McCreary, 14 won by Kallman): | |||
# <span style="color:darkred;">'''Wisconsin, 0.01% (323 votes) – 10 electoral votes'''</span> | |||
# <span style="color:darkred;">'''New Hampshire, 0.25% (1,975 votes) – 4 electoral votes'''</span> (tipping-point state for Kallman victory) | |||
# <span style="color:darkblue;">'''Pennsylvania, 0.45% (29,656 votes) – 19 electoral votes'''</span> | |||
States/districts where the margin of victory was between 1% and 5% (68 electoral votes; 17 won by McCreary, 50 by Kallman): | |||
# <span style="color:darkred;">'''Nevada, 1.29% (17,767 votes) – 6 electoral votes'''</span> '''(tipping-point state for McCreary victory)''' | |||
# <span style="color:darkblue;">'''Michigan, 2.02% (106,299 votes) – 15 electoral votes'''</span> | |||
# <span style="color:darkred;">'''Georgia, 2.64% (129,359 votes) – 16 electoral votes'''</span> | |||
# <span style="color:darkred;">'''Nebraska's 2nd Congressional District, 3.62% (10,904 votes) – 1 electoral vote'''</span> | |||
# <span style="color:darkred;">'''North Carolina, 3.86% (215,390 votes) – 16 electoral votes'''</span> | |||
# <span style="color:darkred;">'''Arizona, 4.05% (134,443 votes) – 11 electoral votes'''</span> | |||
# <span style="color:darkblue;">'''Maine, 4.40% (34,253 votes) – 2 electoral votes'''</span> | |||
States/districts where the margin of victory was between 5% and 10% (145 electoral votes; 52 won by McCreary, 103 by Kallman): | |||
# <span style="color:darkblue;">'''New Mexico, 5.27% (46,258 votes) – 5 electoral votes'''</span> | |||
# <span style="color:darkblue;">'''Virginia, 6.70% (283,912 votes) – 13 electoral votes'''</span> | |||
# <span style="color:darkblue;">'''Colorado, 6.99% (216,280 votes) – 10 electoral votes'''</span> | |||
# <span style="color:darkred;">'''Ohio, 8.16% (473,587 votes) – 17 electoral votes'''</span> | |||
# <span style="color:darkred;">'''Texas, 8.42% (1,000,364 votes) – 40 electoral votes'''</span> | |||
# <span style="color:darkblue;">'''New Jersey, 8.64% (373,419 votes) – 14 electoral votes'''</span> | |||
# <span style="color:darkred;">'''Iowa, 8.73% (144,661 votes) – 6 electoral votes'''</span> | |||
# <span style="color:darkred;">'''Florida, 9.03% (1,049,361 votes) – 30 electoral votes'''</span> | |||
Blue denotes states or congressional districts won by Democrat Frank McCreary; red denotes those won by Republican Amanda Kallman. | |||
==Democrats Summary Table== | ==Democrats Summary Table== | ||
Latest revision as of 01:09, 17 June 2024
2024 General
| |||||||||||||||||||||||||||||
538 members of the Electoral College 270 electoral votes needed to win | |||||||||||||||||||||||||||||
|---|---|---|---|---|---|---|---|---|---|---|---|---|---|---|---|---|---|---|---|---|---|---|---|---|---|---|---|---|---|
| |||||||||||||||||||||||||||||
 Presidential election results map. Red denotes states won by Kallman/Clay and blue denotes those won by McCreary/Sarelli-Sainz. Numbers indicate electoral votes cast by each state and the District of Columbia. On election night, Kallman won 283 electors and McCreary 255. | |||||||||||||||||||||||||||||
| |||||||||||||||||||||||||||||
Close states
States where the margin of victory was under 1% (33 electoral votes; 19 won by McCreary, 14 won by Kallman):
- Wisconsin, 0.01% (323 votes) – 10 electoral votes
- New Hampshire, 0.25% (1,975 votes) – 4 electoral votes (tipping-point state for Kallman victory)
- Pennsylvania, 0.45% (29,656 votes) – 19 electoral votes
States/districts where the margin of victory was between 1% and 5% (68 electoral votes; 17 won by McCreary, 50 by Kallman):
- Nevada, 1.29% (17,767 votes) – 6 electoral votes (tipping-point state for McCreary victory)
- Michigan, 2.02% (106,299 votes) – 15 electoral votes
- Georgia, 2.64% (129,359 votes) – 16 electoral votes
- Nebraska's 2nd Congressional District, 3.62% (10,904 votes) – 1 electoral vote
- North Carolina, 3.86% (215,390 votes) – 16 electoral votes
- Arizona, 4.05% (134,443 votes) – 11 electoral votes
- Maine, 4.40% (34,253 votes) – 2 electoral votes
States/districts where the margin of victory was between 5% and 10% (145 electoral votes; 52 won by McCreary, 103 by Kallman):
- New Mexico, 5.27% (46,258 votes) – 5 electoral votes
- Virginia, 6.70% (283,912 votes) – 13 electoral votes
- Colorado, 6.99% (216,280 votes) – 10 electoral votes
- Ohio, 8.16% (473,587 votes) – 17 electoral votes
- Texas, 8.42% (1,000,364 votes) – 40 electoral votes
- New Jersey, 8.64% (373,419 votes) – 14 electoral votes
- Iowa, 8.73% (144,661 votes) – 6 electoral votes
- Florida, 9.03% (1,049,361 votes) – 30 electoral votes
Blue denotes states or congressional districts won by Democrat Frank McCreary; red denotes those won by Republican Amanda Kallman.
Democrats Summary Table
| Date (daily totals) |
Total pledged delegates |
Contest and total popular vote |
Delegates won and popular vote | |||||||
|---|---|---|---|---|---|---|---|---|---|---|
| Frank McCreary | Kathleen Nez | Carmen Sarelli-Sainz | Carlos Sandoza | Other/Uncommitted | ||||||
| January 15 | 40 | Iowa 211,622 |
22 99,886 (47.2%) |
10 49,250 (23.4%) |
23,278 (11.0%) |
8 37,880 (17.9%) |
1,058 (0.5%) | |||
| January 27 | 23 | New Hampshire 358,052 |
9 136,489 (38.1%) |
8 119,697 (33.4%) |
6 101,866 (28.5%) |
|||||
| February 4 | 55 | South Carolina 647,116 |
40 403,153 (62.3%) |
89,302 (13.8%) |
15 154,661 (23.9%) |
|||||
| February 10 | 36 | Nevada 121,852 |
12 40,625 (33.3%) |
11 37,201 (30.5%) |
13 43,355 (35.6%) |
|||||
| February 20 (First Middle Tuesday) (184) |
17 | Delaware 110,018 |
17 79,642 (72.4%) |
15,128 (13.7%) |
15,249 (13.9%) |
|||||
| 75 | Minnesota 893,038 |
32 381,506 (42.7%) |
26 307,651 (34.5%) |
17 203,880 (22.8%) |
||||||
| 92 | Washington 1,870,531 |
36 726,701 (38.9%) |
36 741,104 (39.6%) |
20 402,725 (21.5%) |
||||||
| February 27 (Second Middle Tuesday) (194) |
48 | Louisiana 320,743 |
28 154,374 (48.1%) |
20 115,243 (35.9%) |
51,126 (15.9%) |
|||||
| 117 | Michigan 1,905,215 |
64 831,436 (43.6%) |
53 697,690 (36.6%) |
376,089 (19.7%) |
||||||
| 29 | New Mexico 297,456 |
10 101,492 (34.1%) |
7 74,453 (25.0%) |
13 121,511 (40.9%) |
||||||
| March 5 (Super Tuesday) (796) |
52 | Alabama 542,512 |
32 336,628 (62.1%) |
20 115,243 (37.9%) |
||||||
| 14 | Alaska 23,711 |
6 10,952 (46.2%) |
8 12,759 (53.8%) |
|||||||
| 6 | American Samoa | 3 |
3 |
|||||||
| 72 | Arizona 736,026 |
33 334,671 (45.5%) |
39 401,355 (54.5%) |
|||||||
| 49 | Connecticut 317,299 |
29 189,015 (59.6%) |
20 128,284 (40.4%) |
|||||||
| 67 | Indiana 597,512 |
35 309,930 (51.9%) |
32 287,583 (48.1%) |
|||||||
| 33 | Kansas 176,248 |
16 85,639 (48.6%) |
17 90,609 (51.4%) |
|||||||
| 17 | Montana 179,968 |
8 90,128 (50.08%) |
7 89,840 (49.92%) |
|||||||
| 56 | Oregon 742,453 |
28 371,152 (49.99%) |
28 371,301 (50.01%) |
|||||||
| 51 | Puerto Rico 105,779 |
26 53,439 (50.5%) |
25 52,339 (49.5%) |
|||||||
| 244 | Texas 1,723,074 |
126 888,589 (51.6%) |
118 834,485 (49.4%) |
|||||||
| 16 | Vermont 162,307 |
8 83,978 (51.7%) |
8 78,329 (48.3%) |
|||||||
| 99 | Virginia 942,049 |
54 509,837 (54.1%) |
45 432,212 (45.9%) |
|||||||
| 16 | West Virginia 242,539 |
8 119,087 (49.1%) |
8 123,452 (50.9%) |
|||||||
| March 12 (Mini Tuesday) (604) |
424 | California 6,941,237 |
215 3,518,513 (50.7%) |
209 3,422,724 (49.3%) |
||||||
| 22 | Hawaii 42,053 |
8 15,421 (36.7%) |
14 26,632 (63.3%) |
|||||||
| 20 | Idaho 130,379 |
10 64,042 (49.1%) |
10 66,337 (50.9%) |
|||||||
| 24 | Maine 130,379 |
13 128,702 (52.1%) |
11 118,422 (47.9%) |
|||||||
| 64 | Missouri 799,334 |
36 446,508 (55.9%) |
28 352,826 (44.1%) |
|||||||
| 36 | Oklahoma 365,137 |
18 179,392 (49.1%) |
18 185,745 (50.9%) |
|||||||
| 14 | South Dakota 84,258 |
7 41,893 (49.7%) |
7 42,365 (50.3%) |
|||||||
| Current Total 1,932 Pledged Delegates Allocated 21,836,641 votes |
992 10,732,821 (49.2%) |
849 9,570,471 (43.8%) |
83 1,493,741 (6.8%) |
8 37,880 (0.2%) |
1,728 (0.01%) | |||||
Republican Summary Table
| ||||||||||||||||||||||
2,467 pledged delegates to the Republican National Convention 1,234 pledged delegates needed to win | ||||||||||||||||||||||
|---|---|---|---|---|---|---|---|---|---|---|---|---|---|---|---|---|---|---|---|---|---|---|
| ||||||||||||||||||||||
 | ||||||||||||||||||||||
| Date (daily totals) |
Total pledged delegates |
Contest and total popular vote |
Delegates won and popular vote | |||||||
|---|---|---|---|---|---|---|---|---|---|---|
| Amanda Kallman | Tom Volker | Marty Spellman | Cal Gaines | Everitt Colbert | Glenn Bullard | Other/Uncommitted | ||||
| January 15 | 40 | Iowa 224,318 |
14 72,455 (32.3%) |
11 61,239 (27.3%) |
8 42,620 (19.0%) |
7 39,480 (17.6%) |
3,589 (1.6%) |
3,140 (1.4%) |
1,795 (0.8%) | |
| January 27 | 22 | New Hampshire 343,099 |
8 102,244 (29.8%) |
6 75,825 (22.1%) |
4 50,779 (14.8%) |
4 50,436 (14.7%) |
32,251 (9.4%) |
31,565 (9.2%) |
||
| February 4 | 50 | South Carolina 817,897 |
39 399,788 (48.9%) |
11 380,895 (46.6%) |
37,214 (4.6%) |
|||||
| February 10 | 26 | Nevada 90,578 |
13 40,625 (49.5%) |
10 37,201 (36.1%) |
3 12,681 (14.0%) |
362 (0.4%) | ||||
| February 20 (First Middle Tuesday) (98) |
16 | Delaware 83,870 |
8 42,053 (50.1%) |
8 41,818 (49.9%) |
||||||
| 39 | Minnesota 137,094 |
19 67,478 (49.2%) |
20 69,616 (50.8%) |
|||||||
| 43 | Washington 723,598 |
23 380,251 (52.6%) |
20 343,347 (47.4%) |
|||||||
| February 27 (Second Middle Tuesday) (123) |
46 | Louisiana 361,489 |
6 178,142 (49.3%) |
40 183,347 (50.7%) |
||||||
| 55 | Michigan 1,588,307 |
37 794,630 (50.03%) |
18 793,677 (49.97%) |
|||||||
| 22 | New Mexico 125,552 |
13 71,565 (57.0%) |
9 53,988 (43.0%) |
|||||||
| Current Total 359 Pledged Delegates Allocated 4,495,803 votes |
180 2,955,304 (47.9%) |
153 2,036,450 (45.3%) |
12 93,399 (2.1%) |
11 89,916 (2.0%) |
3 85,736 (1.9%) |
34,706 (0.8%) |
2,157 (0.1%) | |||
Democrats Table by State
| Candidate | Final alignment |
Pledged national convention delegates | |
|---|---|---|---|
| Frank McCreary | 99,886 | 47.2 | 22 |
| Kathleen Nez | 49,520 | 23.4 | 10 |
| Carlos Sandoza | 37,880 | 17.9 | 8 |
| Carmen Sarelli-Sainz | 23,278 | 11.0 | |
| Uncomitted | 1,058 | 0.50 | |
| Total | 211,622 | 100% | 40 |
| Candidate | Final alignment |
Pledged national convention delegates | |
|---|---|---|---|
| Frank McCreary | 136,489 | 38.1 | 9 |
| Kathleen Nez | 119,697 | 33.4 | 8 |
| Carmen Sarelli-Sainz | 101,866 | 28.5 | 6 |
| Total | 358,052 | 100% | 23 |
| Candidate | Final alignment |
Pledged national convention delegates | |
|---|---|---|---|
| Frank McCreary | 403,153 | 62.3 | 40 |
| Carmen Sarelli-Sainz | 154,661 | 23.9 | 15 |
| Kathleen Nez | 89,302 | 13.8 | |
| Total | 647,116 | 100% | 55 |
Republicans
| Candidate | Final alignment |
Pledged national convention delegates | |
|---|---|---|---|
| Amanda Kallman | 72,455 | 32.3 | 14 |
| Thomas Volker | 61,239 | 27.3 | 11 |
| Martin Spellman | 42,620 | 19.0 | 8 |
| Cal Gaines | 39,480 | 17.6 | 7 |
| Everitt Colbert | 3,589 | 1.6 | |
| Glenn Bullard | 3,140 | 1.4 | |
| Uncomitted | 1,795 | 0.80 | |
| Total | 224,318 | 100% | 40 |
| Candidate | Final alignment |
Pledged national convention delegates | |
|---|---|---|---|
| Amanda Kallman | 102,244 | 29.8 | 8 |
| Thomas Volker | 75,825 | 22.1 | 6 |
| Martin Spellman | 50,779 | 14.8 | 4 |
| Cal Gaines | 50,436 | 14.7 | 4 |
| Everitt Colbert | 32,251 | 9.4 | |
| Glenn Bullard | 31,565 | 9.2 | |
| Total | 343,099 | 100% | 22 |
| Candidate | Final alignment |
Pledged national convention delegates | |
|---|---|---|---|
| Amanda Kallman | 399,788 | 48.9 | 39 |
| Thomas Volker | 380,895 | 46.6 | 11 |
| Everitt Colbert | 37,214 | 4.6 | |
| Total | 817,897 | 100% | 50 |
| Candidate | Final alignment |
Pledged national convention delegates | |
|---|---|---|---|
| Amanda Kallman | 44,836 | 49.5 | 13 |
| Thomas Volker | 32,699 | 36.1 | 10 |
| Everitt Colbert | 12,681 | 14.0 | 3 |
| Uncommitted | 362 | 0.4 | |
| Total | 90,578 | 100% | 26 |


