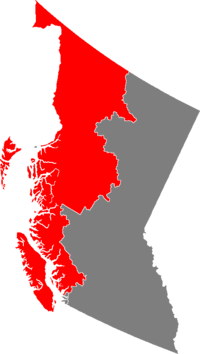
Vancouver Island and Coastal Mainland: Difference between revisions
Jump to navigation
Jump to search
mNo edit summary |
mNo edit summary |
||
| Line 25: | Line 25: | ||
! Votes | ! Votes | ||
! % | ! % | ||
! Seats Before | |||
! Seats | ! Seats | ||
! ± | ! ± | ||
| Line 32: | Line 33: | ||
| 221,909 | | 221,909 | ||
| 44.54 | | 44.54 | ||
| 8 | |||
| 4 | | 4 | ||
| −4 | | −4 | ||
| Line 39: | Line 41: | ||
| 139,880 | | 139,880 | ||
| 28.08 | | 28.08 | ||
| 0 | |||
| 3 | | 3 | ||
| +3 | | +3 | ||
| Line 46: | Line 49: | ||
| 100,843 | | 100,843 | ||
| 20.24 | | 20.24 | ||
| 0 | |||
| 2 | | 2 | ||
| +2 | | +2 | ||
| Line 53: | Line 57: | ||
| 35,602 | | 35,602 | ||
| 7.15 | | 7.15 | ||
| 0 | |||
| 0 | | 0 | ||
| - | | - | ||
Revision as of 18:45, 10 April 2020
Vancouver Island and Coastal Mainland | |
|---|---|
 | |
| Government | 9 members of the House of Commons |
• MP's |
|
| Population | |
• Census | 959,699 |
Election Results
| Parties | Votes | % | Seats Before | Seats | ± | |
|---|---|---|---|---|---|---|
| New Democratic Party | 221,909 | 44.54 | 8 | 4 | −4 | |
| Conservative Party | 139,880 | 28.08 | 0 | 3 | +3 | |
| Liberal Party | 100,843 | 20.24 | 0 | 2 | +2 | |
| Progressive Party | 35,602 | 7.15 | 0 | 0 | - | |
| Labour Party | 0 | 0.00 | 0 | - | ||
| Total | 498,234 | 100% | 9 | |||