OOC:Sarenium: Difference between revisions
Jump to navigation
Jump to search
mNo edit summary |
mNo edit summary |
||
| Line 15: | Line 15: | ||
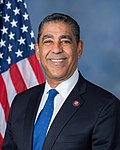
| color1 = 041254 | | color1 = 041254 | ||
| home_state1 = {{font color|#0645AD|Delaware}} | | home_state1 = {{font color|#0645AD|Delaware}} | ||
| popular_vote1 = | | popular_vote1 = 680,153 | ||
| percentage1 = | | percentage1 = 50.8% | ||
| delegate_count1 = | | delegate_count1 = 83 | ||
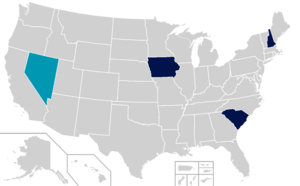
| states_carried1 = 3 | | states_carried1 = 3 | ||
| Line 24: | Line 24: | ||
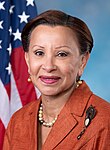
| color2 = 0097b2 | | color2 = 0097b2 | ||
| home_state2 = {{font color|#0645AD|New Mexico}} | | home_state2 = {{font color|#0645AD|New Mexico}} | ||
| popular_vote2 = | | popular_vote2 = 323,160 | ||
| percentage2 = | | percentage2 = 24.1% | ||
| delegate_count2 = | | delegate_count2 = 34 | ||
| states_carried2 = | | states_carried2 = 1 | ||
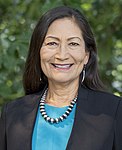
| image4 = [[File:Secretary Deb Haaland, official headshot.jpg|x150px]] | | image4 = [[File:Secretary Deb Haaland, official headshot.jpg|x150px]] | ||
| Line 33: | Line 33: | ||
| color4 = ff6100 | | color4 = ff6100 | ||
| home_state4 = {{font color|#0645AD|Arizona}} | | home_state4 = {{font color|#0645AD|Arizona}} | ||
| popular_vote4 = | | popular_vote4 = 295,720 | ||
| percentage4 = | | percentage4 = 22.1% | ||
| delegate_count4 = | | delegate_count4 = 29 | ||
| states_carried4 = 0 | | states_carried4 = 0 | ||
| Line 43: | Line 43: | ||
| home_state5 = {{font color|#0645AD|Nevada}} | | home_state5 = {{font color|#0645AD|Nevada}} | ||
| popular_vote5 = 37,880 | | popular_vote5 = 37,880 | ||
| percentage5 = | | percentage5 = 2.8% | ||
| delegate_count5 = 8 | | delegate_count5 = 8 | ||
| states_carried5 = 0 | | states_carried5 = 0 | ||
| Line 103: | Line 103: | ||
|- | |- | ||
| colspan="3" | '''Current Total'''<br/> | | February 10 | ||
| ''' | | 55 | ||
| | | {{font color|#0645AD|Nevada}}<br/>{{small|121,852}} | ||
| | | 12<br/> 40,625 (33.3% | ||
|style="background: lightgrey;" | 8 <br/> 37,880 ( | | style="background: #B2FFFF;" | '''13''' <br/> '''43,355 (35.6%)''' | ||
|style="background: lightgrey;" | <br/> 1, | | 11 <br/> 37,201 (30.5%) | ||
|style="background: lightgrey;" | | |||
|style="background: lightgrey;" | | |||
|- | |||
| colspan="3" | '''Current Total'''<br/>146 Pledged Delegates Allocated<br/>{{small|1,338,641 votes}} | |||
| '''83'''<br/>'''680,153 (50.8%)''' | |||
| 34 <br/> 323,160 (24.1%) | |||
| 29 <br/> 295,720 (22.1%) | |||
|style="background: lightgrey;" | 8 <br/> 37,880 (2.8%) | |||
|style="background: lightgrey;" | <br/> 1,728 (0.1%) | |||
|} | |} | ||
Revision as of 23:08, 29 October 2023
Democrats Summary Table
| Date (daily totals) |
Total pledged delegates |
Contest and total popular vote |
Delegates won and popular vote | |||||||
|---|---|---|---|---|---|---|---|---|---|---|
| Frank McCreary | Carmen Sarelli-Sainz | Kathleen Nez | Carlos Sandoza | Other/Uncommitted | ||||||
| January 15 | 40 | Iowa 211,622 |
22 99,886 (47.2%) |
0 23,278 (11.0%) |
10 49,250 (23.4%) |
8 37,880 (17.9%) |
- 1,058 (0.5%) | |||
| January 27 | 23 | New Hampshire 358,052 |
9 136,489 (38.1%) |
6 101,866 (28.5%) |
8 119,697 (33.4%) |
|||||
| February 4 | 55 | South Carolina 647,116 |
40 403,153 (62.3%) |
15 154,661 (23.9%) |
89,302 (13.8%) |
|||||
| February 10 | 55 | Nevada 121,852 |
12 40,625 (33.3% |
13 43,355 (35.6%) |
11 37,201 (30.5%) |
|||||
| Current Total 146 Pledged Delegates Allocated 1,338,641 votes |
83 680,153 (50.8%) |
34 323,160 (24.1%) |
29 295,720 (22.1%) |
8 37,880 (2.8%) |
1,728 (0.1%) | |||||
Democrats Table by State
| Candidate | Final alignment |
Pledged national convention delegates | |
|---|---|---|---|
| Frank McCreary | 99,886 | 47.2 | 22 |
| Kathleen Nez | 49,520 | 23.4 | 10 |
| Carlos Sandoza | 37,880 | 17.9 | 8 |
| Carmen Sarelli-Sainz | 23,278 | 11.0 | |
| Uncomitted | 1,058 | 0.50 | |
| Total | 211,622 | 100% | 40 |
| Candidate | Final alignment |
Pledged national convention delegates | |
|---|---|---|---|
| Frank McCreary | 136,489 | 38.1 | 9 |
| Kathleen Nez | 119,697 | 33.4 | 8 |
| Carmen Sarelli-Sainz | 101,866 | 28.5 | 6 |
| Total | 358,052 | 100% | 23 |
| Candidate | Final alignment |
Pledged national convention delegates | |
|---|---|---|---|
| Frank McCreary | 403,153 | 62.3 | 40 |
| Carmen Sarelli-Sainz | 154,661 | 23.9 | 15 |
| Kathleen Nez | 89,302 | 13.8 | |
| Total | 647,116 | 100% | 55 |
Republicans
| Candidate | Final alignment |
Pledged national convention delegates | |
|---|---|---|---|
| Amanda Kallman | 72,455 | 32.3 | 14 |
| Thomas Volker | 61,239 | 27.3 | 11 |
| Martin Spellman | 42,620 | 19.0 | 8 |
| Cal Gaines | 39,480 | 17.6 | 7 |
| Everitt Colbert | 3,589 | 1.6 | |
| Glenn Bullard | 3,140 | 1.4 | |
| Uncomitted | 1,795 | 0.80 | |
| Total | 224,318 | 100% | 40 |
| Candidate | Final alignment |
Pledged national convention delegates | |
|---|---|---|---|
| Amanda Kallman | 102,244 | 29.8 | 8 |
| Thomas Volker | 75,825 | 22.1 | 6 |
| Martin Spellman | 50,779 | 14.8 | 4 |
| Cal Gaines | 50,436 | 14.7 | 4 |
| Everitt Colbert | 32,251 | 9.4 | |
| Glenn Bullard | 31,565 | 9.2 | |
| Total | 343,099 | 100% | 22 |
| Candidate | Final alignment |
Pledged national convention delegates | |
|---|---|---|---|
| Amanda Kallman | 399,788 | 48.9 | 39 |
| Thomas Volker | 380,895 | 46.6 | 11 |
| Everitt Colbert | 37,214 | 4.6 | |
| Total | 817,897 | 100% | 50 |


