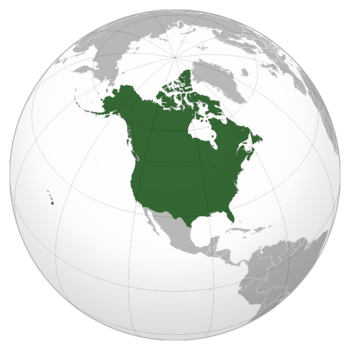
Greater Hitiatium: Difference between revisions
Jump to navigation
Jump to search
mNo edit summary |
mNo edit summary |
||
| Line 136: | Line 136: | ||
{{climate chart | {{climate chart | ||
| <!--- [[Greater Hitiatium]] ---> | | <!--- [[Greater Hitiatium]] ---> | ||
|4.1|32.2| | |4.1|32.2|7.9 | ||
|8.7|33.3| | |8.7|33.3|0.4 | ||
|9.2|34.1| | |9.2|34.1|3.6 | ||
|9.3|34.5| | |9.3|34.5|84.8 | ||
|10.4|37.3| | |10.4|37.3|75.2 | ||
|11.6|38.7| | |11.6|38.7|96.9 | ||
|12.7|40.5| | |12.7|40.5|87.0 | ||
|12.3|41.7| | |12.3|41.7|32.2 | ||
|11.5|39.4|105.7 | |11.5|39.4|105.7 | ||
|9.9|38.5|96.8 | |9.9|38.5|96.8 | ||
|9.7|35.3|97.6 | |9.7|35.3|97.6 | ||
|5.7|32.5|56.4 | |5.7|32.5|56.4 | ||
|maxprecip = <!--- supply largest monthly precipitation, in case it's > 750 mm (30 in.) ---> | |maxprecip = <!--- supply largest monthly precipitation, in case it's > 750 mm (30 in.) ---> 1000 | ||
|float = <!--- left, right, or none ---> right | |float = <!--- left, right, or none ---> right | ||
|clear = <!--- left, right, both, or none ---> right | |clear = <!--- left, right, both, or none ---> right | ||
| Line 198: | Line 198: | ||
|Dec mean C = 19.5 | |Dec mean C = 19.5 | ||
|year mean C = | |year mean C = | ||
|Jan precipitation mm = | |Jan precipitation mm = 7.9 | ||
|Feb precipitation mm = | |Feb precipitation mm = 0.4 | ||
|Mar precipitation mm = | |Mar precipitation mm = 3.6 | ||
|Apr precipitation mm = | |Apr precipitation mm = 32.2 | ||
|May precipitation mm = | |May precipitation mm = 75.2 | ||
|Jun precipitation mm = | |Jun precipitation mm = 96.9 | ||
|Jul precipitation mm = | |Jul precipitation mm = 87.0 | ||
|Aug precipitation mm = | |Aug precipitation mm = 84.8 | ||
|Sep precipitation mm = 105.7 | |Sep precipitation mm = 105.7 | ||
|Oct precipitation mm = 97.6 | |Oct precipitation mm = 97.6 | ||
Revision as of 21:26, 30 December 2023
Soviet People's Democratic Republic of Greater Hitiatium | |
|---|---|
|
Flag | |
 |
| Climate chart (explanation) | ||||||||||||||||||||||||||||||||||||||||||||||||||||||||||||
|---|---|---|---|---|---|---|---|---|---|---|---|---|---|---|---|---|---|---|---|---|---|---|---|---|---|---|---|---|---|---|---|---|---|---|---|---|---|---|---|---|---|---|---|---|---|---|---|---|---|---|---|---|---|---|---|---|---|---|---|---|
| ||||||||||||||||||||||||||||||||||||||||||||||||||||||||||||
| ||||||||||||||||||||||||||||||||||||||||||||||||||||||||||||
| Climate data for insert location | |||||||||||||
|---|---|---|---|---|---|---|---|---|---|---|---|---|---|
| Month | Jan | Feb | Mar | Apr | May | Jun | Jul | Aug | Sep | Oct | Nov | Dec | Year |
| Average high °C (°F) | 32.2 (90.0) |
32.5 (90.5) |
34.1 (93.4) |
34.5 (94.1) |
37.3 (99.1) |
38.7 (101.7) |
40.5 (104.9) |
41.7 (107.1) |
39.4 (102.9) |
38.5 (101.3) |
35.3 (95.5) |
33.3 (91.9) |
36.5 (97.7) |
| Daily mean °C (°F) | 18.1 (64.6) |
20.6 (69.1) |
21.6 (70.9) |
21.9 (71.4) |
23.8 (74.8) |
25.1 (77.2) |
26.6 (79.9) |
27.0 (80.6) |
25.4 (77.7) |
24.2 (75.6) |
22.5 (72.5) |
19.5 (67.1) |
23.0 (73.5) |
| Average low °C (°F) | 4.1 (39.4) |
8.7 (47.7) |
9.2 (48.6) |
9.3 (48.7) |
10.4 (50.7) |
11.6 (52.9) |
12.7 (54.9) |
12.3 (54.1) |
11.5 (52.7) |
9.9 (49.8) |
9.7 (49.5) |
5.7 (42.3) |
9.6 (49.3) |
| Average precipitation mm (inches) | 7.9 (0.31) |
0.4 (0.02) |
3.6 (0.14) |
32.2 (1.27) |
75.2 (2.96) |
96.9 (3.81) |
87.0 (3.43) |
84.8 (3.34) |
105.7 (4.16) |
97.6 (3.84) |
96.8 (3.81) |
59.4 (2.34) |
747.5 (29.43) |
| Source: [NAME OF THE WEBSITE] | |||||||||||||
