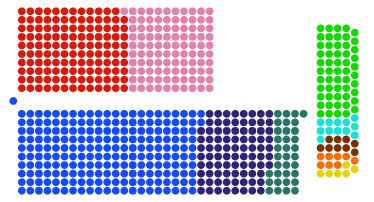
2017 Capsland General Election: Difference between revisions
Jump to navigation
Jump to search
No edit summary |
No edit summary |
||
| Line 10: | Line 10: | ||
| next_election = 2022 Capsland general election | | next_election = 2022 Capsland general election | ||
| next_year = 2022 | | next_year = 2022 | ||
| majority_seats = 326 | | seats_for_election= All 650 seats to the [[National Parliament]] <br> ''This is the result of the largest six parties, for the full result see [[#Results|below]]'' | ||
| majority_seats = 326 | |||
| turnout = 69.20% | | turnout = 69.20% | ||
| image_size = 160x180px | | image_size = 160x180px | ||
| Line 92: | Line 93: | ||
| percentage6 = 5.25% | | percentage6 = 5.25% | ||
<!-- map --> | <!-- map --> | ||
Revision as of 21:56, 23 July 2019
This article is incomplete because it is pending further input from participants, or it is a work-in-progress by one author. Please comment on this article's talk page to share your input, comments and questions. Note: To contribute to this article, you may need to seek help from the author(s) of this page. |
| |||||||||||||||||||||||||||||||||||||||||||||||||||||||||||||||||||||||||||||||||||||
All 650 seats to the National Parliament This is the result of the largest six parties, for the full result see below 326 seats needed for a majority | |||||||||||||||||||||||||||||||||||||||||||||||||||||||||||||||||||||||||||||||||||||
|---|---|---|---|---|---|---|---|---|---|---|---|---|---|---|---|---|---|---|---|---|---|---|---|---|---|---|---|---|---|---|---|---|---|---|---|---|---|---|---|---|---|---|---|---|---|---|---|---|---|---|---|---|---|---|---|---|---|---|---|---|---|---|---|---|---|---|---|---|---|---|---|---|---|---|---|---|---|---|---|---|---|---|---|---|---|
| Turnout | 69.20% | ||||||||||||||||||||||||||||||||||||||||||||||||||||||||||||||||||||||||||||||||||||
| |||||||||||||||||||||||||||||||||||||||||||||||||||||||||||||||||||||||||||||||||||||
 Results in the National Parliament | |||||||||||||||||||||||||||||||||||||||||||||||||||||||||||||||||||||||||||||||||||||
| |||||||||||||||||||||||||||||||||||||||||||||||||||||||||||||||||||||||||||||||||||||


