2017 Capsland General Election: Difference between revisions
Jump to navigation
Jump to search
(Changed infobox to legislative election) |
|||
| Line 1: | Line 1: | ||
{{WIP}} | {{WIP}} | ||
{{Infobox election | {{Infobox legislative election | ||
| election_name = 2017 Capsland general election | | election_name = 2017 Capsland general election | ||
| country = Capsland | | country = Capsland | ||
Revision as of 18:47, 25 July 2019
This article is incomplete because it is pending further input from participants, or it is a work-in-progress by one author. Please comment on this article's talk page to share your input, comments and questions. Note: To contribute to this article, you may need to seek help from the author(s) of this page. |
| ||||||||||||||||||||||||||||||||||||
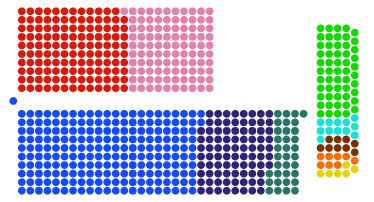
All 650 seats to the National Parliament This is the result of the largest six parties, for the full result see below 326 seats needed for a majority | ||||||||||||||||||||||||||||||||||||
|---|---|---|---|---|---|---|---|---|---|---|---|---|---|---|---|---|---|---|---|---|---|---|---|---|---|---|---|---|---|---|---|---|---|---|---|---|
| Turnout | 69.20% | |||||||||||||||||||||||||||||||||||
This lists parties that won seats. See the complete results below. | ||||||||||||||||||||||||||||||||||||
| ||||||||||||||||||||||||||||||||||||
Background
Results

| |||||
|---|---|---|---|---|---|
| Party | Leader(s) | Votes | % | Seats | +/– |
| Democracy Party | David George | 12,406,120 | 32.61 | 212 | +10 |
| Social Democratic Party | Brant Rennard | 7,786,694 | 19.84 | 129 | -105 |
| Socialist-Bloc | Wilson Daniels | 6,083,356 | 15.50 | 101 | +64 |
| Christian Democrats | David Marde | 5,161,040 | 13.15 | 85 | +85 |
| Green and Liberal Alliance | Natalie Mason & Jeremy Garth | 3,233,990 | 8.24 | 54 | -32 |
| Popular Front | Gordon Hughmann | 2,060,491 | 5.25 | 34 | +34 |
| Liberation Party | Julien Piccard | 733,927 | 1.87 | 12 | +3 |
| National Liberal Party | Jared Garbute | 545,540 | 1.39 | 9 | +9 |
| Libertarian Union | Guy Garrison | 459,195 | 1.17 | 8 | -31 |
| Capsland Sovereign Party | Henry Farthing | 384,625 | 0.98 | 6 | -37 |
| Total | - | 38,854,978 | 100 | 650 | - |
| Registered voters/turnout | - | 56,148,000 | 69.20 | - | - |