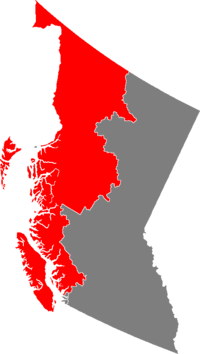
Vancouver Island and Coastal Mainland: Difference between revisions
Jump to navigation
Jump to search
mNo edit summary |
mNo edit summary |
||
| Line 20: | Line 20: | ||
}} | }} | ||
==Election Results== | ==Election Results== | ||
{{electiontable|Table template pagename|Vancouver Island and Coastal Mainland Election Results, April 2020}} | |||
|- | |||
! colspan="2" style="text-align:left;" | Parties | |||
! Votes | |||
! % | |||
| ±% | |||
! Seats Before | |||
! Seats | |||
! ± | |||
|- | |||
| style="background-color:#f37021;" | | |||
| style="text-align:left;" | New Democratic Party | |||
| | |||
| | |||
| | |||
| 4 | |||
| | |||
| | |||
|- | |||
| style="background-color:#005dab;" | | |||
| style="text-align:left;" | Conservative Party | |||
| | |||
| | |||
| | |||
| 3 | |||
| | |||
| | |||
|- | |||
| style="background-color:#d71920;" | | |||
| style="text-align:left;" | Liberal Party | |||
| | |||
| | |||
| | |||
| 1 | |||
| | |||
| | |||
|- | |||
| style="background-color:#0806a7;" | | |||
| style="text-align:left;" | Libertarian Party | |||
| | |||
| | |||
| | |||
| 1 | |||
| | |||
| | |||
|- | |||
| style="background-color:#ffd700;" | | |||
| style="text-align:left;" | Freedom Party | |||
| | |||
| | |||
| | |||
| - | |||
| | |||
| | |||
|- | |||
| style="background-color:#674ea7;" | | |||
| style="text-align:left;" | Pirate Party | |||
| | |||
| | |||
| | |||
| - | |||
| | |||
| | |||
|- | |||
! colspan="2" style="text-align:left;" | Total | |||
! | |||
! style="text-align:center;" colspan="2"| 100% | |||
! style="text-align:center;" colspan="3"| 9 | |||
|} | |||
{{electiontable|Table template pagename|Vancouver Island and Coastal Mainland Election Results, February 2020}} | {{electiontable|Table template pagename|Vancouver Island and Coastal Mainland Election Results, February 2020}} | ||
|- | |- | ||
Revision as of 19:00, 10 April 2020
Vancouver Island and Coastal Mainland | |
|---|---|
 | |
| Government | 9 members of the House of Commons |
• MP's |
|
| Population | |
• Census | 959,699 |
Election Results
| Parties | Votes | % | ±% | Seats Before | Seats | ± | |
|---|---|---|---|---|---|---|---|
| New Democratic Party | 4 | ||||||
| Conservative Party | 3 | ||||||
| Liberal Party | 1 | ||||||
| Libertarian Party | 1 | ||||||
| Freedom Party | - | ||||||
| Pirate Party | - | ||||||
| Total | 100% | 9 | |||||
| Parties | Votes | % | ±% | Seats Before | Seats | ± | |
|---|---|---|---|---|---|---|---|
| New Democratic Party | 221,909 | 44.54 | 8 | 4 | −4 | ||
| Conservative Party | 139,880 | 28.08 | 0 | 3 | +3 | ||
| Liberal Party | 100,843 | 20.24 | 0 | 2 | +2 | ||
| Progressive Party | 35,602 | 7.15 | 0 | 0 | - | ||
| Labour Party | 0 | 0.00 | 0 | 0 | - | ||
| Total | 498,234 | 100% | 9 | ||||