1970 Agrestiumontian general election: Difference between revisions
Jump to navigation
Jump to search
No edit summary |
No edit summary |
||
| Line 61: | Line 61: | ||
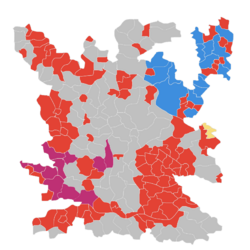
| map_caption = Largest political party by municipality<BR>{{colorbox|#E34234}} [[Social Democrats (Agrestiumontia)|SD]] {{colorbox|#C0C0C0}} [[People's Union (Agrestiumontia)|PU]] {{colorbox|#3E8EDE}} [[Regionalist People's Party|RPP]] {{colorbox|#BE3075}} [[Communist Party of Agrestiumontia|Communist]] {{colorbox|#F8DE7E}} [[League of Independents and Regionalists|LSR]] | | map_caption = Largest political party by municipality<BR>{{colorbox|#E34234}} [[Social Democrats (Agrestiumontia)|SD]] {{colorbox|#C0C0C0}} [[People's Union (Agrestiumontia)|PU]] {{colorbox|#3E8EDE}} [[Regionalist People's Party|RPP]] {{colorbox|#BE3075}} [[Communist Party of Agrestiumontia|Communist]] {{colorbox|#F8DE7E}} [[League of Independents and Regionalists|LSR]] | ||
}} | }} | ||
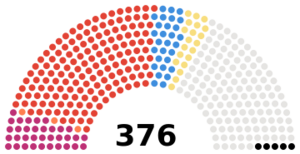
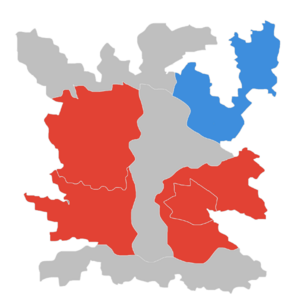
The 1970 election was influenced by the {{wp|May 68}}-protests in France. The incumbent centre-right government lost heavily. The [[Communist Party of Agrestiumontia|Communists]] won their best result ever, winning 34 seats. The Communists became the largest party in the Lousands Lakes-region, winning 32.3% of votes (up from 16.2% in 1966). | |||
The [[Social Democrats (Agrestiumontia)|Social Democrats]] were able to form a left-wing majority government with the Communists and the [[Radical Left (Agrestiumontia)|Radical Left]]. | |||
== Results == | == Results == | ||
{| class=wikitable style=text-align:right | {| class=wikitable style=text-align:right | ||
Revision as of 01:27, 19 July 2021
| |||||||||||||||||||||||||||||||||
All 376 seats in the National Assembly 188 seats needed for a majority | |||||||||||||||||||||||||||||||||
|---|---|---|---|---|---|---|---|---|---|---|---|---|---|---|---|---|---|---|---|---|---|---|---|---|---|---|---|---|---|---|---|---|---|
| Turnout | 90.0% ( | ||||||||||||||||||||||||||||||||
| |||||||||||||||||||||||||||||||||
 | |||||||||||||||||||||||||||||||||
The 1970 election was influenced by the May 68-protests in France. The incumbent centre-right government lost heavily. The Communists won their best result ever, winning 34 seats. The Communists became the largest party in the Lousands Lakes-region, winning 32.3% of votes (up from 16.2% in 1966).
The Social Democrats were able to form a left-wing majority government with the Communists and the Radical Left.
Results

| |||||||
|---|---|---|---|---|---|---|---|
| 1970 Agrestiumontian general election | |||||||
| Party | % | Seats | +/– | ||||
| People's Union | PU | 34.1% | 131 | ||||
| Regionalist People's Party | RPP | 7.7% | 29 | ||||
| '62 Alliance | 41.8% | 160 | |||||
| Social Democrats | SD | 40.6% | 154 | ||||
| Communist Party | KPA | 8.6% | 34 | ||||
| League of Independents and Regionalists | LSR | 5.3% | 20 | ||||
| National Bloc | NB | 2.3% | 5 | ||||
| Radical Left | RM | 1.2% | 3 | ||||
| Others | 0.2% | 0 | |||||
| Total | 100% | 376 | |||||
By Region

| ||||||||
|---|---|---|---|---|---|---|---|---|
| Regions | SD | PU | RPP | KPA | LSR | NB | RM | Others |
| Region of the Capital | 50.4 | 25.1 | - | 7.0 | 10.0 | 0.6 | 6.6 | 0.3 |
| The Suburbs | 54.3 | 31.0 | - | 6.6 | 6.2 | 1.2 | 0.4 | 0.3 |
| Middle Mountains | 30.7 | 50.0 | - | 3.4 | 5.2 | 10.0 | 0.4 | 0.3 |
| Spitsberg | 30.4 | - | 61.7 | 3.4 | 3.8 | 0.1 | 0.2 | 0.4 |
| Northern Pass | 43.2 | 45.0 | - | 5.1 | 4.6 | 1.5 | 0.3 | 0.3 |
| Southern Pass | 40.4 | 48.0 | - | 4.6 | 4.8 | 1.6 | 0.4 | 0.2 |
| Thousand Lakes | 31.0 | 30.7 | - | 32.3 | 4.3 | 1.6 | - | 0.2 |
| Yellow Mountain | 44.5 | 42.6 | - | 6.4 | 3.3 | 2.0 | 1.0 | 0.2 |