Economy of Krenya: Difference between revisions
Jump to navigation
Jump to search
No edit summary |
No edit summary |
||
| Line 13: | Line 13: | ||
|inflation = [[National Prices Board|5.6%]] | |inflation = [[National Prices Board|5.6%]] | ||
|poverty = N/A {{small|(2020)}} | |poverty = N/A {{small|(2020)}} | ||
|gini = 42 | |gini = 42 | ||
|labor = 14 million {{small|(2020)}} | |labor = 14 million {{small|(2020)}} | ||
|occupations = Services: 32,1%<br/>Industry: 40,9%<br/>Agriculture: 18,0% | |occupations = Services: 32,1%<br/>Industry: 40,9%<br/>Agriculture: 18,0% | ||
Revision as of 17:22, 29 July 2021
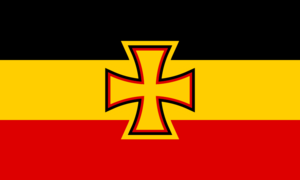
 Flag of Krenya | |
| Currency | Krenen (KNN) |
|---|---|
| 1 March — 31 April | |
Trade organisations | None |
| Statistics | |
| GDP | 840 billion ACU (PPP, 2020) |
GDP growth | 1.2% (2020) |
GDP per capita | 42,125 ACU (PPP, 2020) |
GDP by sector | Services: 30,7% Industry: 42,3% Agriculture: 18,0% |
| 5.6% | |
Population below poverty line | N/A (2020) |
| 42 | |
Labour force | 14 million (2020) |
Labour force by occupation | Services: 32,1% Industry: 40,9% Agriculture: 18,0% |
| Unemployment | 2-5% (2020) |
Main industries | List
|
| External | |
Export goods | List
|
Import goods | List
|