Economy of Brumen: Difference between revisions
Jump to navigation
Jump to search
mNo edit summary |
mNo edit summary |
||
| Line 15: | Line 15: | ||
| per capita = {{increase}} $20,800 (Nominal, 2020)<br>{{increase}} $23,074 (PPP, 2020) | | per capita = {{increase}} $20,800 (Nominal, 2020)<br>{{increase}} $23,074 (PPP, 2020) | ||
| per capita rank = 45th (Nominal, 2020) | | per capita rank = 45th (Nominal, 2020) | ||
| sectors = {{wp|Primary sector of the economy|Agriculture/Fisheries}} | | sectors = {{wp|Primary sector of the economy|Agriculture/Fisheries}} 19%<br>{{wp|Secondary sector of the economy|Manufacturing}} 37%<br>{{wp|Tertiary sector of the economy|Services}} 44% | ||
| components = | | components = | ||
| inflation = {{increaseNegative}} 1.93% (2020) | | inflation = {{increaseNegative}} 1.93% (2020) | ||
Revision as of 00:55, 6 September 2022
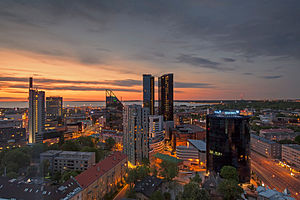
 Central Business District of Dinsmark | |
| Currency | Bon (BON, Bn) |
|---|---|
| Calendar Year | |
| Statistics | |
| Population | 32,893,755 (2020 Census) |
| GDP | |
| GDP rank | 45th (Nominal, 2020) |
GDP per capita | |
GDP per capita rank | 45th (Nominal, 2020) |
GDP by sector | Agriculture/Fisheries 19% Manufacturing 37% Services 44% |
Population below poverty line | |
Labour force by occupation | Agriculture/Fisheries 39% Manufacturing 37% Services 24% |
| Unemployment | |
Average gross salary | Bn 54,000 (Monthly, 2022) |
| Bn 39,000 (Monthly, 2022) | |
Main industries | Petroleum Refinery, Fishery, Financial Services, Arms Manufacturing, Aquaculture, Mining, Electronics |
All values, unless otherwise stated, are in US dollars. | |