2021 Steinborgian federal election
Jump to navigation
Jump to search
| |||||||||||||||||||||||||||||||||||||||||||||||||||||||||||||||||||||||||||||||||||||||||||||||||||||||||||||||||||||
All 355 seats in the Federal Parliament 178 seats needed for a majority | |||||||||||||||||||||||||||||||||||||||||||||||||||||||||||||||||||||||||||||||||||||||||||||||||||||||||||||||||||||
|---|---|---|---|---|---|---|---|---|---|---|---|---|---|---|---|---|---|---|---|---|---|---|---|---|---|---|---|---|---|---|---|---|---|---|---|---|---|---|---|---|---|---|---|---|---|---|---|---|---|---|---|---|---|---|---|---|---|---|---|---|---|---|---|---|---|---|---|---|---|---|---|---|---|---|---|---|---|---|---|---|---|---|---|---|---|---|---|---|---|---|---|---|---|---|---|---|---|---|---|---|---|---|---|---|---|---|---|---|---|---|---|---|---|---|---|---|---|
| Registered | 70,901,252 | ||||||||||||||||||||||||||||||||||||||||||||||||||||||||||||||||||||||||||||||||||||||||||||||||||||||||||||||||||||
| Turnout | 51,611,381 (72.8%) | ||||||||||||||||||||||||||||||||||||||||||||||||||||||||||||||||||||||||||||||||||||||||||||||||||||||||||||||||||||
| |||||||||||||||||||||||||||||||||||||||||||||||||||||||||||||||||||||||||||||||||||||||||||||||||||||||||||||||||||||
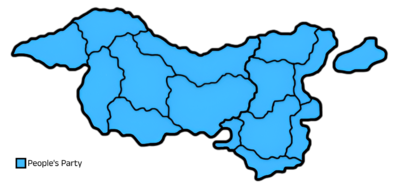
 Biggest party by constituency. The shade of the color indicates the strenght of the vote share. | |||||||||||||||||||||||||||||||||||||||||||||||||||||||||||||||||||||||||||||||||||||||||||||||||||||||||||||||||||||
| |||||||||||||||||||||||||||||||||||||||||||||||||||||||||||||||||||||||||||||||||||||||||||||||||||||||||||||||||||||
Federal elections were held in Steinborg on 31 October 2021 to elect the members of the 24th Federal Parliament.
Electoral system
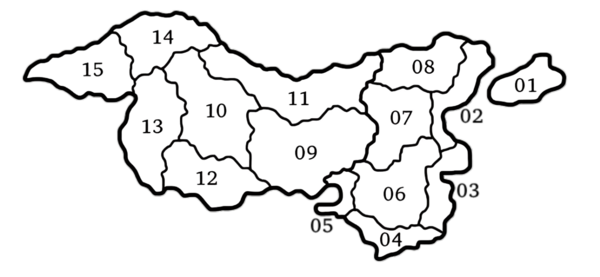
The 200 members of the Federal Parliament are elected in 15 multi-member constituencies, being the fourteen counties and the island of Ensamo. Seats are allocated to the parties using the Sainte-Laguë method. Seats are distributed to constituencies based on the number of registered voters in them. The distribution of seats for the 2021 election was as follows:
| Constituency | Seats | 
|
|---|---|---|
| 01 Ensamo | 3 | |
| 02 Pohjameri | 26 | |
| 03 Iounameri | 25 ( | |
| 04 Laanemaa | 21 | |
| 05 Parla | 42 ( | |
| 06 Tooru | 33 | |
| 07 Keskmaa | 21 | |
| 08 Kirkmaa | 17 ( | |
| 09 Itanien Kotimaa | 21 | |
| 10 Lantinen Kotimaa | 23 | |
| 11 Isovouri | 13 | |
| 12 Rohland | 18 ( | |
| 13 Mustastein | 26 ( | |
| 14 Valkenstein | 32 ( | |
| 15 Vappe | 34 |
All Steinborgian citizens aged 18 or over have the right to participate in the election. Non-Steinborgian citizens residing in Steinborg cannot vote, whereas Steinborgian citizens living abroad can register to vote.
Parties
| Party | Ideology | Political position | Leader | 2017 result | Status |
|---|---|---|---|---|---|
| People's Party | Liberal conservatism | Centre-right to right-wing |
Viktor Leppik | 109 / 150 |
Governing coalition |
| Social Democratic Party | Social democracy | Centre-left | Mikko Lahtinen | 58 / 150 |
Opposition |
| Christian Democratic Forum | Christian democracy | Centre to centre-right |
Juri Ilves | 41 / 150 |
Governing coalition |
| Worker's Party | Socialism Social conservatism |
Left-wing to far-left |
Olga Raudsepp | 35 / 150 |
Opposition |
| Green Party | Green politics | Centre-left | Kristel Miller | 34 / 150 |
Opposition |
| Alternative | Right-wing populism | Right-wing to far-right |
Anne Nieminen | 34 / 150 |
Opposition |
| New Democracy | Social liberalism | Centre to centre-left |
Karin Lill | 24 / 150 |
Confidence and supply |
| Liberals | Liberalism Conservative liberalism |
Centre-right | Niko Huhtala | 20 / 150 |
Governing coalition |
Results
National results
| Parties | Votes | % | ± | Seats | ± | |
|---|---|---|---|---|---|---|
| People's Party | 16,570,786 | 32.74 | 121 | |||
| Green Party | 6,528,028 | 12.89 | 46 | |||
| Social Democratic Party | 6,332,323 | 12.51 | 47 | |||
| Christian Democratic Forum | 6,207,125 | 12.27 | 44 | |||
| Worker's Party | 3,635,901 | 7.18 | 28 | |||
| Liberals | 3,497,892 | 6.91 | 25 | |||
| New Democracy | 3,016,224 | 5.96 | 21 | |||
| Alternative | 2,828,825 | 5.59 | 23 | |||
| Others | 1,988,216 | 3.93 | 0 | |||
| Total | 50,605,320 | 100.00 | 355 | |||
| Invalid/blank votes | 1,006,061 | 1.95 | ||||
| Total | 51,611,381 | 100.00 | ||||
| Registered voters/turnout | 70,901,452 | 72.79 | ||||


