2018 Polatan General Election
Jump to navigation
Jump to search
| |||||||||||||||||||||||||||||||||||||||||||||||||||||||||||||||||||||||||||||||||||||||||||||
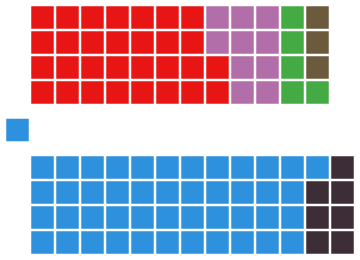
All 100 Seats in the People’s Assembly 51 seats needed for a majority | |||||||||||||||||||||||||||||||||||||||||||||||||||||||||||||||||||||||||||||||||||||||||||||
|---|---|---|---|---|---|---|---|---|---|---|---|---|---|---|---|---|---|---|---|---|---|---|---|---|---|---|---|---|---|---|---|---|---|---|---|---|---|---|---|---|---|---|---|---|---|---|---|---|---|---|---|---|---|---|---|---|---|---|---|---|---|---|---|---|---|---|---|---|---|---|---|---|---|---|---|---|---|---|---|---|---|---|---|---|---|---|---|---|---|---|---|---|---|
| Registered | 9,400,856 | ||||||||||||||||||||||||||||||||||||||||||||||||||||||||||||||||||||||||||||||||||||||||||||
| Turnout | 99% | ||||||||||||||||||||||||||||||||||||||||||||||||||||||||||||||||||||||||||||||||||||||||||||
| |||||||||||||||||||||||||||||||||||||||||||||||||||||||||||||||||||||||||||||||||||||||||||||
| |||||||||||||||||||||||||||||||||||||||||||||||||||||||||||||||||||||||||||||||||||||||||||||
The 2018 Polatan General Election was held on 2 July, 2018 after then Prime Minister John Wickers asked Prince James II for an election.
A total of 9,306,847 votes where cast in the election making it 99% of the total 9,400,856 registered voters. 94,009 people where fined for failure to vote in this election.
Election
Polls
Full Results

| ||||||
| Party | Votes | % | Seats | +/– | ||
|---|---|---|---|---|---|---|
| Conservatives | 2,689,679 | 28.9 | 45 | –6 | ||
| Liberal | 1,982,358 | 21.3 | 30 | +3 | ||
| Northern Alliance | 1,340,186 | 14.4 | 10 | +1 | ||
| Nationalists | 1,172,663 | 12.6 | 7 | +2 | ||
| Green | 1,070,287 | 11.5 | 5 | 0 | ||
| Mountain | 781,775 | 8.4 | 3 | +1 | ||
| Pirate Party | 145,187 | 1.56 | 0 | -1 | ||
| Llama United Party | 66,079 | 0.71 | 0 | 0 | ||
| Republican Alliance | 30,713 | 0.33 | 0 | 0 | ||
| Loony Party | 9,307 | 0.10 | 0 | 0 | ||
| Justice | 6,514 | 0.07 | 0 | New | ||
| Thermodolian Movement | 4,653 | 0.05 | 0 | 0 | ||
| Social Democrats | 2,792 | 0.03 | 0 | 0 | ||
| Northern Independence | 931 | 0.01 | 0 | 0 | ||
| Workers United | 930 | 0.01 | 0 | 0 | ||
| Liberal Democrats | 929 | 0.01 | 0 | 0 | ||
| One Polata | 465 | 0.005 | 0 | 0 | ||
| Libertarians | 279 | 0.003 | 0 | 0 | ||
| Democracy Now! | 186 | 0.002 | 0 | New | ||
| National Unity | 185 | 0.002 | 0 | 0 | ||
| Christian Democrats | 47 | 0.0005 | 0 | 0 | ||
| Bible Bloc | 46 | 0.0005 | 0 | 0 | ||
| Invalid/blank votes | 642 | 0.007 | – | – | ||
| Total | 9,306,847 | 100 | 100 | 0 | ||
| Registered voters/turnout | 9,400,856 | 99 | – | – | ||
Members of Parliament who lost their Seats
| Party | Name | Year elected |
|---|---|---|
| Pirate Party | Luke Raymond | 2010 |
| Conservatives | John Wickers | 2000 |
| Conservatives | Edmond Fasea | 2014 |
| Conservatives | Jacob Roll | 2014 |
| Conservatives | Roy Folkman | 2010 |
| Conservatives | Mary Garan | 2008 |
| Conservatives | Mitch Russo | 1998 |


