2018 Polatan General Election
| |||||||||||||||||||||||||||||||||||||||||||||||||||||||||||||||||||||||||||||||||||||||||||||
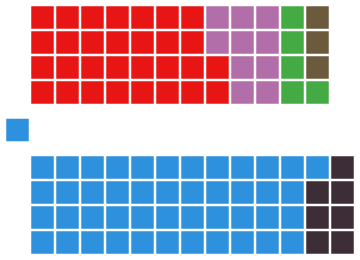
All 100 Seats in the People’s Assembly 51 seats needed for a majority | |||||||||||||||||||||||||||||||||||||||||||||||||||||||||||||||||||||||||||||||||||||||||||||
|---|---|---|---|---|---|---|---|---|---|---|---|---|---|---|---|---|---|---|---|---|---|---|---|---|---|---|---|---|---|---|---|---|---|---|---|---|---|---|---|---|---|---|---|---|---|---|---|---|---|---|---|---|---|---|---|---|---|---|---|---|---|---|---|---|---|---|---|---|---|---|---|---|---|---|---|---|---|---|---|---|---|---|---|---|---|---|---|---|---|---|---|---|---|
| Registered | 9,400,856 | ||||||||||||||||||||||||||||||||||||||||||||||||||||||||||||||||||||||||||||||||||||||||||||
| Turnout | 99% | ||||||||||||||||||||||||||||||||||||||||||||||||||||||||||||||||||||||||||||||||||||||||||||
| |||||||||||||||||||||||||||||||||||||||||||||||||||||||||||||||||||||||||||||||||||||||||||||
| |||||||||||||||||||||||||||||||||||||||||||||||||||||||||||||||||||||||||||||||||||||||||||||
The 2018 Polatan General Election was held on 2 July, 2018 after then Prime Minister John Wickers asked Prince James II for an election.
A total of 9,306,847 votes where cast in the election making it 99% of the total 9,400,856 registered voters. 94,009 people where fined for failure to vote in this election.
Election
The 2018 General Election came about as then Prime Minister John Wickers wished to keep the elections on a four year schedule. As such he requested that an election be held and Prince James II granted that request. The election was set for 2 July, 2018.
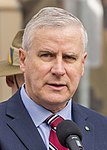
The Conservative Party which was led by Mary Sasor due to the results of the previous Conservative leadership election. John Wickers did not stand in this election as Prime Minister. The close change in party leadership and Wickers decision to not stand cost the party greatly as they lost both their majority and lost the greatest number of seats
Polls
Full Results

| ||||||
| Party | Votes | % | Seats | +/– | ||
|---|---|---|---|---|---|---|
| Conservatives | 2,689,679 | 28.9 | 45 | –6 | ||
| Liberal | 1,982,358 | 21.3 | 30 | +3 | ||
| Northern Alliance | 1,340,186 | 14.4 | 10 | +1 | ||
| Nationalists | 1,172,663 | 12.6 | 7 | +2 | ||
| Green | 1,070,287 | 11.5 | 5 | 0 | ||
| Mountain | 781,775 | 8.4 | 3 | +1 | ||
| Pirate Party | 145,187 | 1.56 | 0 | -1 | ||
| Llama United Party | 66,079 | 0.71 | 0 | 0 | ||
| Republican Alliance | 30,713 | 0.33 | 0 | 0 | ||
| Loony Party | 9,307 | 0.10 | 0 | 0 | ||
| Justice | 6,514 | 0.07 | 0 | New | ||
| Thermodolian Movement | 4,653 | 0.05 | 0 | 0 | ||
| Social Democrats | 2,792 | 0.03 | 0 | 0 | ||
| Northern Independence | 931 | 0.01 | 0 | 0 | ||
| Workers United | 930 | 0.01 | 0 | 0 | ||
| Liberal Democrats | 929 | 0.01 | 0 | 0 | ||
| One Polata | 465 | 0.005 | 0 | 0 | ||
| Libertarians | 279 | 0.003 | 0 | 0 | ||
| Democracy Now! | 186 | 0.002 | 0 | New | ||
| National Unity | 185 | 0.002 | 0 | 0 | ||
| Christian Democrats | 47 | 0.0005 | 0 | 0 | ||
| Bible Bloc | 46 | 0.0005 | 0 | 0 | ||
| Invalid/blank votes | 642 | 0.007 | – | – | ||
| Total | 9,306,847 | 100 | 100 | 0 | ||
| Registered voters/turnout | 9,400,856 | 99 | – | – | ||
Members of Parliament who lost their Seats
| Party | Name | Year elected |
|---|---|---|
| Pirate Party | Luke Raymond | 2010 |
| Conservatives | John Wickers | 2000 |
| Conservatives | Edmond Fasea | 2014 |
| Conservatives | Jacob Roll | 2014 |
| Conservatives | Roy Folkman | 2010 |
| Conservatives | Mary Garan | 2008 |
| Conservatives | Mitch Russo | 1998 |


