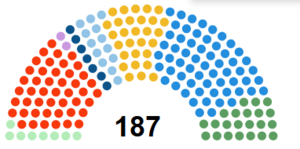
Shalfland Election results
Jump to navigation
Jump to search
| Party | District Vote | Region Vote | Seats | ± | |
|---|---|---|---|---|---|
| Alliance | 35.1 | 22.7 | 60 | ||
| Social Democratic Labour Party | 21.5 | 25.8 | 46 | ||
| Radical Party | 19.3 | 18.3 | 29 | ||
| People's Party | 11.3 | 14.5 | 22 | ||
| Liberal Party | 5.6 | 3.9 | 13 | ||
| Reform Party | 3.1 | 5.1 | 8 | ||
| National Alternative | 2.6 | 5.8 | 7 | ||
| Good Health Party | 0.6 | 1.5 | 2 | ||
| Popular Democrats | 0.6 | 1.4 | 0 | ||
| Labour Party | 0.1 | 0.4 | 0 | - | |
| Independent Democrats | 0.1 | 0.1 | 0 | - | |
| Republican Shalfland | 0.1 | 0.1 | 0 | - | |
| Others | 0.1 | 0.4 | 0 | - | |
| Total | 100 | 100 | 187 | 0 | |
| Registered voters/turnout | 4,579,262 | 78.95 | – | – | |
