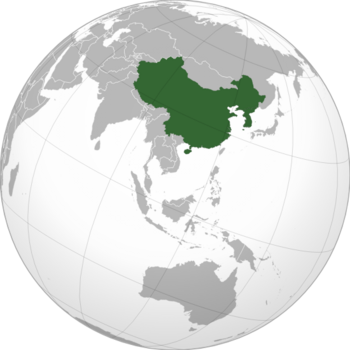
Nanqihar
Republic of the Union of Nanqihar | |
|---|---|
| Anthem: | |
 | |
| Capital | Zhaoping |
| Largest largest city | Xinjinping |
| Official languages | Chinese |
| Religion (2022) | 16.44% Buddhist 15.97% Shintō 15.81% Confucianism 15.43% Christianity 10.29% No religion 26.06% Unspecified |
| Government | Unitary maoist one party socialist state |
• President | Mao Zedong |
• Prime Minister | Deng Xiaoping |
| Area | |
• Total | 9,820,133 km2 (3,791,575 sq mi) |
| Population | |
• Census | 1,490,399,972 |
| Gini | 0 low |
| HDI | very high |
| Currency | None |
| Time zone | UTC+9 |
| Driving side | right |
Nanqihar (IPA: ɴæɴtɕʰʏhəʐ, Traditional Chinese: 南齊哈爾) officially the Republic of the Union of Nanqihar is a colossal, environmentally stunned nation located in East Asia and remarkable for its public floggings, irreverence towards religion and state-planned economy.
Geography
Most of Nanqihar enjoys a humid subtropical climate, with warm humid summers and cool not that cold winters. However, in the highest elevations such as the Luntai highlands, it predominates the humid subtropical highland climate, with freezy nights. Rainfall is mostly recorded during summer, when other countries are in the monsoon season (jì fēng jì jié) being July the month with most precipitation, averaging between 100–250 millimetres (3.9–9.8 in). Winters are dry and clear, the country's dry season.
| Climate data for Zhaoping (Cfa) | |||||||||||||
|---|---|---|---|---|---|---|---|---|---|---|---|---|---|
| Month | Jan | Feb | Mar | Apr | May | Jun | Jul | Aug | Sep | Oct | Nov | Dec | Year |
| Average high °C (°F) | 16.4 (61.5) |
19.7 (67.5) |
23.5 (74.3) |
23.8 (74.8) |
28.4 (83.1) |
31.3 (88.3) |
35.8 (96.4) |
31.5 (88.7) |
30.0 (86.0) |
27.9 (82.2) |
22.2 (72.0) |
18.7 (65.7) |
25.8 (78.4) |
| Daily mean °C (°F) | 10.1 (50.2) |
13.2 (55.8) |
16.4 (61.5) |
16.9 (62.4) |
20.1 (68.2) |
21.7 (71.1) |
25.8 (78.4) |
23.3 (73.9) |
22.1 (71.8) |
21.0 (69.8) |
15.3 (59.5) |
12.6 (54.7) |
18.2 (64.8) |
| Average low °C (°F) | 3.9 (39.0) |
6.8 (44.2) |
9.4 (48.9) |
10.0 (50.0) |
11.8 (53.2) |
12.1 (53.8) |
15.9 (60.6) |
15.1 (59.2) |
14.2 (57.6) |
14.1 (57.4) |
8.4 (47.1) |
6.5 (43.7) |
10.7 (51.2) |
| Average precipitation mm (inches) | 32.2 (1.27) |
39.9 (1.57) |
43.8 (1.72) |
45.6 (1.80) |
73.4 (2.89) |
94.5 (3.72) |
101.2 (3.98) |
93.7 (3.69) |
65.9 (2.59) |
33.9 (1.33) |
30.6 (1.20) |
28.4 (1.12) |
683.1 (26.88) |
| Source: [NAME OF THE WEBSITE] | |||||||||||||
| Climate data for Luntai (Cwb) | |||||||||||||
|---|---|---|---|---|---|---|---|---|---|---|---|---|---|
| Month | Jan | Feb | Mar | Apr | May | Jun | Jul | Aug | Sep | Oct | Nov | Dec | Year |
| Average high °C (°F) | 10.3 (50.5) |
13.6 (56.5) |
17.4 (63.3) |
17.7 (63.9) |
22.3 (72.1) |
25.2 (77.4) |
29.7 (85.5) |
25.4 (77.7) |
23.9 (75.0) |
21.8 (71.2) |
16.1 (61.0) |
12.6 (54.7) |
19.7 (67.4) |
| Daily mean °C (°F) | 5.6 (42.1) |
7.9 (46.2) |
10.2 (50.4) |
11.5 (52.7) |
13.9 (57.0) |
15.5 (59.9) |
18.0 (64.4) |
15.6 (60.1) |
14.5 (58.1) |
13.3 (55.9) |
10.1 (50.2) |
8.0 (46.4) |
12.0 (53.6) |
| Average low °C (°F) | 0.9 (33.6) |
2.2 (36.0) |
3.0 (37.4) |
5.4 (41.7) |
5.5 (41.9) |
5.9 (42.6) |
6.3 (43.3) |
5.8 (42.4) |
5.2 (41.4) |
4.8 (40.6) |
4.2 (39.6) |
3.5 (38.3) |
4.4 (39.9) |
| Average precipitation mm (inches) | 4.3 (0.17) |
13.8 (0.54) |
47.9 (1.89) |
97.9 (3.85) |
124.0 (4.88) |
198.4 (7.81) |
232.8 (9.17) |
151.6 (5.97) |
81.9 (3.22) |
33.0 (1.30) |
20.1 (0.79) |
0.1 (0.00) |
1,005.8 (39.59) |
| Source: [NAME OF THE WEBSITE] | |||||||||||||
