1972 Central Shaneville Presidential election: Difference between revisions
No edit summary |
|||
| Line 20: | Line 20: | ||
<!-- | <!-- Progressive --> | ||
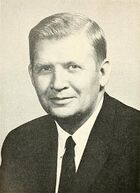
| image1 = [[File: | | image1 = [[File:Louis Guille.jpg|140px]] | ||
| leader1 = | | leader1 = Louis Guille | ||
| leaders_seat1 = | | leaders_seat1 = Centrale | ||
| colour1 = | | colour1 = FF6A00 | ||
| party1 = | | party1 = New Democratic Party | ||
| alliance1 = | | alliance1 = | ||
| leader_since1 = | | leader_since1 = January 1970 | ||
| last_election1 = | | last_election1 = 1,837,680 (22.0%) | ||
| seats_before1 = | | seats_before1 = 25 | ||
| seats1 = - | | seats1 = - | ||
| seat_change1 = - | | seat_change1 = - | ||
| Line 54: | Line 54: | ||
<!-- | <!-- Liberal --> | ||
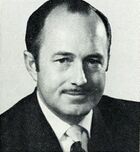
| image3 = [[File: | | image3 = [[File:Steve_McLaren.jpg|150px]] | ||
| leader3 = | | leader3 = Steve McLaren | ||
| leaders_seat3 = | | leaders_seat3 = Cagliari | ||
| colour3 = | | colour3 = ff0000 | ||
| party3 = | | party3 = Liberal Party | ||
| alliance3 = | | alliance3 = | ||
| leader_since3 = | | leader_since3 = October 1960 | ||
| last_election3 = | | last_election3 = 3,759,607 (45.8%) | ||
| seats_before3 = | | seats_before3 = 157 | ||
| seats3 = - | | seats3 = - | ||
| seat_change3 = - | | seat_change3 = - | ||
Revision as of 22:52, 16 November 2021
 | |||||||||||||||||||||||||||||||||||||||||||||||||||||||||||||||||||||||||||||||||||||||||
264 seats in the Central Shaneville Parliament (CSP) 133 seats needed for a majority | |||||||||||||||||||||||||||||||||||||||||||||||||||||||||||||||||||||||||||||||||||||||||
|---|---|---|---|---|---|---|---|---|---|---|---|---|---|---|---|---|---|---|---|---|---|---|---|---|---|---|---|---|---|---|---|---|---|---|---|---|---|---|---|---|---|---|---|---|---|---|---|---|---|---|---|---|---|---|---|---|---|---|---|---|---|---|---|---|---|---|---|---|---|---|---|---|---|---|---|---|---|---|---|---|---|---|---|---|---|---|---|---|---|
| Turnout | 89% | ||||||||||||||||||||||||||||||||||||||||||||||||||||||||||||||||||||||||||||||||||||||||
| |||||||||||||||||||||||||||||||||||||||||||||||||||||||||||||||||||||||||||||||||||||||||
| |||||||||||||||||||||||||||||||||||||||||||||||||||||||||||||||||||||||||||||||||||||||||
The 1972 Central Shaneville Presidential election was held on the 10 November 1972 - Steve McLaren was the incumbent president and the Liberal Party were the incumbent party - The Liberals' plans of building a larger and more prosperous economy have drawn mixed reactions following his address of infrastructure issues early in his third term.
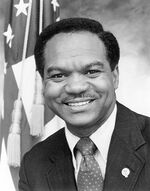
The leader of the Conservatives, John M Perkins, is the first black presidential candidate for a major political party in Central Shaneville history and he has a strong following among the black community, he has also been criticized by liberals who feel he is too socially conservative, though he has defended his position on his political views saying he is "a different kind of Conservative to get back Central Shaneville from the Liberals."
The Liberals are still predicted to win meaning Steve McLaren would be the first president to sit four terms, he is now also the longest sitting President, taking over his predecessor John Dunston's record in that regard.
The Exit polls suggested that the 1972 election would be the closest election in history with the New Democratic Party on top with the Conservatives and the incumbent Liberals tied at the time of the exit polls.
Exit Poll
The Exit Poll took place a week before the election and predicted the following:
| Parties | Seats | Change | |
|---|---|---|---|
| New Democratic Party | 81 | - | |
| Liberal Party | 77 | - | |
| Progressive Conservative Party | 77 | - | |
| Social Credit Workers' Party | 22 | - | |
| Undecided | 7 | - | |
| NEW DEMOCRATIC PARTY WINS A MINORITY GOVERNMENT | |||
Results
After all electoral districts had been declared, the results were:
| Party | Leader | MLs | Votes | |||||
|---|---|---|---|---|---|---|---|---|
| Of total | Of total | |||||||
| New Democratic Party | Louis Guille | 114 | 0.0% | 114 / 264
|
xxx | 36.6% | 36.6% | |
| Progressive Conservative Party | John M. Perkins | 75 | 0.0% | 75 / 264
|
xxx | 29.4% | 29.4% | |
| Liberal Party | Steve McLaren (Incumbent) |
51 | 0.0% | 51 / 264
|
xxx | 26.9%' | 26.9% | |
| Social Credit Workers' Party | Harry Grocer | 23 | 0.0% | 23 / 264
|
xxx | 7.2% | 7.2% | |


