Sandbox/UK/LA: Difference between revisions
Jump to navigation
Jump to search
No edit summary |
No edit summary |
||
| Line 1: | Line 1: | ||
{{Infobox election | |||
| election_name = 2003 United Kingdom general election | |||
| country = United Kingdom | |||
| type = parliamentary | |||
| ongoing = no | |||
| previous_election = 2001 United Kingdom general election | |||
| previous_year = 2001 | |||
| outgoing_members = List of MPs elected in the 2001 United Kingdom general election | |||
| elected_members = List of MPs elected in the 2005 United Kingdom general election | |||
| next_election = 2007 United Kingdom general election | |||
| next_year = 2007 | |||
| seats_for_election = All {{wp|List of United Kingdom Parliament constituencies (2005–2010)|646 seats}} to the {{wp|House of Commons of the United Kingdom|House of Commons}} | |||
| majority_seats = 324{{refn|group=n|Given that Sinn Féin {{wp|members of Parliament}} (MPs) practise {{wp|abstentionism}} and do not take their seats, while the Speaker and deputies do not vote, the number of MPs needed for a majority was in practice slightly lower.<ref name=working>{{cite web |url=https://www.instituteforgovernment.org.uk/explainers/government-majority |title=Government majority |website=Institute for Government|date=20 December 2019 }}</ref> Sinn Féin won 5 seats, meaning a practical majority required 319 MPs.}} | |||
| election_date = 20 November 2003 | |||
| registered = 44,245,939 | |||
| turnout = 27,148,510<br>61.4% ({{increase}}2.0 {{wp|Percentage point|pp}}) | |||
| opinion_polls = Opinion polling for the 2005 United Kingdom general election | |||
<!-- Conservative -->| image1 = {{CSS image crop|Image=David Grant PM.png|bSize = 120|cWidth = 120|cHeight = 160|oTop = 0|oLeft = 0}} | |||
| leader1 = {{wp|David Grant}} | |||
| leader_since1 = {{wp|2001 Conservative Party leadership election|13 September 2001}} | |||
| party1 = Conservative Party (UK) | |||
| leaders_seat1 = {{wp|Canterbury (UK Parliament constituency)|Canterbury}} | |||
| last_election1 = 338 seats, 39.4% | |||
| seats_before1 = 338 | |||
| seats1 = 365 | |||
| seat_change1 = {{increase}} 27*<!-- note: the boundaries changed from the previous election + 33 is a nominal change figure from the seats the party would have won based on those boundaries. --> | |||
| popular_vote1 = 10,696,512 | |||
| percentage1 = 41.6% | |||
| swing1 = {{increase}} 2.2 {{wp|Percentage point|pp}} | |||
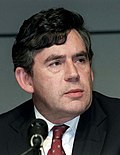
<!-- Labour -->| image2 = {{CSS image crop|Image=Gordon Brown portrait.jpg|bSize = 120|cWidth = 120|cHeight = 160|oTop = 0|oLeft = 0}} | |||
| leader2 = {{wp|Gordon Brown}} | |||
| leader_since2 = {{wp|1994 Labour Party leadership election|12 May 2004}} | |||
| party2 = Labour Party (UK) | |||
| leaders_seat2 = {{wp|Kirkcaldy and Cowdenbeath (UK Parliament constituency)|Kirkcaldy and Cowdenbeath}} | |||
| last_election2 = 225 seats, 30.1% | |||
| seats_before2 = 225 | |||
| seats2 = 207{{sup|‡}} | |||
| seat_change2 = {{decrease}} 18*<!-- note: the boundaries changed from the previous election - 48 is a nominal change figure from the seats the party would have won based on those boundaries. --> | |||
| popular_vote2 = 8,198,850 | |||
| percentage2 = 29.1% | |||
| swing2 = {{decrease}} 1.1 {{wp|Percentage point|pp}} | |||
<!-- Liberal Democrats -->| image3 = {{CSS image crop|Image=Chris Huhne (cropped).jpg|bSize = 120|cWidth = 120|cHeight = 160|oTop = 0|oLeft = 0}} | |||
| leader3 = {{wp|Chris Huhne}} | |||
| leader_since3 = {{wp|1999 Liberal Democrats leadership election|9 September 2006}} | |||
| party3 = Liberal Democrats (UK) | |||
| leaders_seat3 = {{wp|Eastleigh (UK Parliament constituency)|Eastleigh}} | |||
| last_election3 = 51 seats, 20.0 | |||
| seats_before3 = 51 | |||
| seats3 = 45 | |||
| seat_change3 = {{decrease}} 7*<!-- note: the boundaries changed from the previous election + 11 is a nominal change figure from the seats the party would have won based on those boundaries. --> | |||
| popular_vote3 = 5,429,702 | |||
| percentage3 = 19.2% | |||
| swing3 = {{decrease}} 0.8 {{wp|Percentage point|pp}} | |||
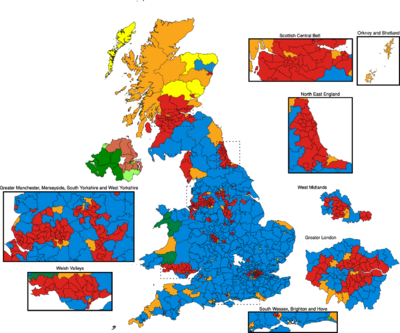
| map_image = 2003UKElectionMapLA.png | |||
| map_size = 400px | |||
| map_caption = Colours denote the winning party, as shown in the main table of results.<br /> | |||
''* Indicates boundary change – so this is a notional figure'' | |||
''{{sup|‡}} Figure does not include the {{wp|Speaker of the House of Commons (United Kingdom)|Speaker}}, {{wp|Michael Martin, Baron Martin of Springburn|Michael Martin}}'' | |||
| title = {{wp|Prime Minister of the United Kingdom|Prime Minister}} | |||
| posttitle = Prime Minister after election | |||
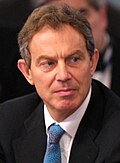
| before_election = {{wp|Tony Blair}} | |||
| before_party = Labour Party (UK) | |||
| after_election = {{wp|David Grant}} | |||
| after_party = Conservative Party (UK) | |||
| map2_image = House_of_Commons_2003_Election_LA.svg | |||
| map2_caption = Composition of the {{wp|House of Commons of the United Kingdom|House of Commons}} after the election | |||
| map2_size = 360px | |||
}} | |||
{{Infobox election | {{Infobox election | ||
| election_name = 2003 United Kingdom general election | | election_name = 2003 United Kingdom general election | ||
Revision as of 20:09, 27 December 2024
| |||||||||||||||||||||||||||||||||||||||||||||||||
All 646 seats to the House of Commons 324[n 1] seats needed for a majority | |||||||||||||||||||||||||||||||||||||||||||||||||
|---|---|---|---|---|---|---|---|---|---|---|---|---|---|---|---|---|---|---|---|---|---|---|---|---|---|---|---|---|---|---|---|---|---|---|---|---|---|---|---|---|---|---|---|---|---|---|---|---|---|
| Opinion polls | |||||||||||||||||||||||||||||||||||||||||||||||||
| Registered | 44,245,939 | ||||||||||||||||||||||||||||||||||||||||||||||||
| Turnout | 27,148,510 61.4% ( | ||||||||||||||||||||||||||||||||||||||||||||||||
| |||||||||||||||||||||||||||||||||||||||||||||||||
 Colours denote the winning party, as shown in the main table of results. * Indicates boundary change – so this is a notional figure ‡ Figure does not include the Speaker, Michael Martin | |||||||||||||||||||||||||||||||||||||||||||||||||
 Composition of the House of Commons after the election | |||||||||||||||||||||||||||||||||||||||||||||||||
| |||||||||||||||||||||||||||||||||||||||||||||||||
| |||||||||||||||||||||||||||||||||||||||||||||||||
All 646 seats to the House of Commons 324[n 2] seats needed for a majority | |||||||||||||||||||||||||||||||||||||||||||||||||
|---|---|---|---|---|---|---|---|---|---|---|---|---|---|---|---|---|---|---|---|---|---|---|---|---|---|---|---|---|---|---|---|---|---|---|---|---|---|---|---|---|---|---|---|---|---|---|---|---|---|
| Opinion polls | |||||||||||||||||||||||||||||||||||||||||||||||||
| Registered | 44,245,939 | ||||||||||||||||||||||||||||||||||||||||||||||||
| Turnout | 27,148,510 61.4% ( | ||||||||||||||||||||||||||||||||||||||||||||||||
| |||||||||||||||||||||||||||||||||||||||||||||||||
 Colours denote the winning party, as shown in the main table of results. * Indicates boundary change – so this is a notional figure ‡ Figure does not include the Speaker, Michael Martin | |||||||||||||||||||||||||||||||||||||||||||||||||
 Composition of the House of Commons after the election | |||||||||||||||||||||||||||||||||||||||||||||||||
| |||||||||||||||||||||||||||||||||||||||||||||||||
- ↑ 1.0 1.1 "Government majority". Institute for Government. 20 December 2019.
Cite error: <ref> tags exist for a group named "n", but no corresponding <references group="n"/> tag was found


