Sandbox/UK/LA
Jump to navigation
Jump to search
| |||||||||||||||||||||||||||||||||||||||||||||||||
All 646 seats to the House of Commons 324[n 1] seats needed for a majority | |||||||||||||||||||||||||||||||||||||||||||||||||
|---|---|---|---|---|---|---|---|---|---|---|---|---|---|---|---|---|---|---|---|---|---|---|---|---|---|---|---|---|---|---|---|---|---|---|---|---|---|---|---|---|---|---|---|---|---|---|---|---|---|
| Opinion polls | |||||||||||||||||||||||||||||||||||||||||||||||||
| Registered | 44,245,939 | ||||||||||||||||||||||||||||||||||||||||||||||||
| Turnout | 27,148,510 63.0% ( | ||||||||||||||||||||||||||||||||||||||||||||||||
| |||||||||||||||||||||||||||||||||||||||||||||||||
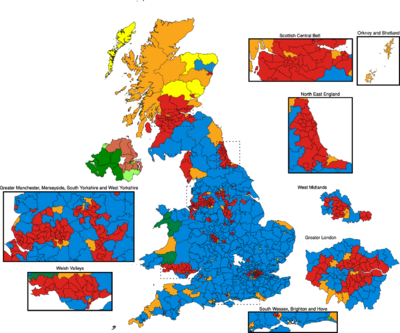 Colours denote the winning party, as shown in the main table of results. * Indicates boundary change – so this is a notional figure ‡ Figure does not include the Speaker, Michael Martin | |||||||||||||||||||||||||||||||||||||||||||||||||
 Composition of the House of Commons after the election | |||||||||||||||||||||||||||||||||||||||||||||||||
| |||||||||||||||||||||||||||||||||||||||||||||||||
| |||||||||||||||||||||||||||||||||||||||||||||||||
All 646 seats to the House of Commons 324[n 2] seats needed for a majority | |||||||||||||||||||||||||||||||||||||||||||||||||
|---|---|---|---|---|---|---|---|---|---|---|---|---|---|---|---|---|---|---|---|---|---|---|---|---|---|---|---|---|---|---|---|---|---|---|---|---|---|---|---|---|---|---|---|---|---|---|---|---|---|
| Opinion polls | |||||||||||||||||||||||||||||||||||||||||||||||||
| Registered | 44,245,939 | ||||||||||||||||||||||||||||||||||||||||||||||||
| Turnout | 27,148,510 61.4% ( | ||||||||||||||||||||||||||||||||||||||||||||||||
| |||||||||||||||||||||||||||||||||||||||||||||||||
 Colours denote the winning party, as shown in the main table of results. * Indicates boundary change – so this is a notional figure ‡ Figure does not include the Speaker, Michael Martin | |||||||||||||||||||||||||||||||||||||||||||||||||
 Composition of the House of Commons after the election | |||||||||||||||||||||||||||||||||||||||||||||||||
| |||||||||||||||||||||||||||||||||||||||||||||||||
| |||||||||||||||||||||||||||||||||||||||||||||||
| |||||||||||||||||||||||||||||||||||||||||||||||
| |||||||||||||||||||||||||||||||||||||||||||||||
- ↑ 1.0 1.1 "Government majority". Institute for Government. 20 December 2019.
Cite error: <ref> tags exist for a group named "n", but no corresponding <references group="n"/> tag was found
