1940 Central Shaneville Presidential election: Difference between revisions
No edit summary |
|||
| (5 intermediate revisions by the same user not shown) | |||
| Line 9: | Line 9: | ||
| previous_election = | | previous_election = | ||
| previous_year = [[1936 Central Shaneville Presidential election|1936]] | | previous_year = [[1936 Central Shaneville Presidential election|1936]] | ||
| previous_mps = | | previous_mps = | ||
| election_date = {{Start date|1940|10|11|df=y}} | | election_date = {{Start date|1940|10|11|df=y}} | ||
| next_election = | | next_election = | ||
| next_year = | | next_year = [[1944 Central Shaneville Presidential election|1944]] | ||
| next_mps = | | next_mps = | ||
| seats_for_election= 180 seats in the Central Shaneville Parliament (CSP) | | seats_for_election= 180 seats in the Central Shaneville Parliament (CSP) | ||
| Line 19: | Line 19: | ||
| turnout = 83.6% | | turnout = 83.6% | ||
<!-- | |||
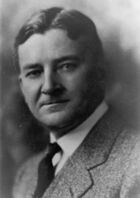
| image1 = [[File: | <!-- National Workers' Alliance --> | ||
| leader1 = | | image1 = [[File:George_Hargrave.jpg|140px]] | ||
| leaders_seat1 = | | leader1 = George Hargrave | ||
| colour1 | | leaders_seat1 = Ajaccio | ||
| party1 = | | colour1 = 8B4522 | ||
| party1 = National Workers' Alliance | |||
| alliance1 = | | alliance1 = | ||
| leader_since1 = | | leader_since1 = March 1932 | ||
| last_election1 = | | last_election1 = ''71,862 (26.5%)'' | ||
| seats_before1 = | | seats_before1 = ''85'' | ||
| seats1 = | | seats1 = ''56'' | ||
| seat_change1 = - | | seat_change1 = ''-29'' | ||
| popular_vote1 = | | popular_vote1 = ''68,951'' | ||
| percentage1 = | | percentage1 = ''25.6%'' | ||
| swing1 = - | | swing1 = - | ||
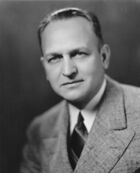
<!-- | <!-- Conservatives --> | ||
| image2 = [[File: | | image2 = [[File:James_Moore_CSV.jpg|140px]] | ||
| leader2 = | | leader2 = James Moore | ||
| leaders_seat2 = | | leaders_seat2 = Shaneville City | ||
| colour2 = | | colour2 = 0087dc | ||
| party2 = | | party2 = Conservative Party | ||
| alliance2 = | | alliance2 = | ||
| leader_since2 = | | leader_since2 = September 1940 | ||
| last_election2 = | | last_election2 = 70,169 (25.9%) | ||
| seats_before2 = | | seats_before2 = 53 | ||
| seats2 | | seats2 = 55 | ||
| seat_change2 = | | seat_change2 = +2 | ||
| popular_vote2 = | | popular_vote2 = 68,156 | ||
| percentage2 = | | percentage2 = 25.3% | ||
| swing2 = - | | swing2 = - | ||
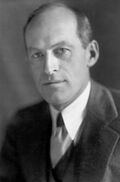
<!-- | <!-- Liberal --> | ||
| image3 = [[File: | | image3 = [[File:Louis_Banderas.jpg|120px]] | ||
| leader3 = | | leader3 = Louis Banderas | ||
| leaders_seat3 = | | leaders_seat3 = Sassari | ||
| colour3 = | | colour3 = ff0000 | ||
| party3 = | | party3 = Liberal Party | ||
| alliance3 = | | alliance3 = | ||
| leader_since3 = | | leader_since3 = December 1936 | ||
| last_election3 = | | last_election3 = 59,735 (22%) | ||
| seats_before3 = | | seats_before3 = 5 | ||
| seats3 = | | seats3 = 43 | ||
| seat_change3 = | | seat_change3 = +38 | ||
| popular_vote3 = | | popular_vote3 = 67,588 | ||
| percentage3 = | | percentage3 = 25.1% | ||
| swing3 = - | | swing3 = - | ||
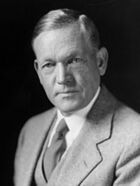
<!-- | <!-- Progressive --> | ||
| image4 = [[File: | | image4 = [[File:Thomas_Valentine.jpg|140px]] | ||
| leader4 = | | leader4 = Thomas Valentine | ||
| leaders_seat4 = | | leaders_seat4 = Grass Hill | ||
| colour4 = | | colour4 = 228B22 | ||
| party4 = | | party4 = Progressive Party | ||
| alliance4 = | | alliance4 = | ||
| leader_since4 = | | leader_since4 = October 1932 | ||
| last_election4 = | | last_election4 = 69,953 (25.6%) | ||
| seats_before4 = | | seats_before4 = 37 | ||
| seats4 = | | seats4 = 26 | ||
| seat_change4 = - | | seat_change4 = -11 | ||
| popular_vote4 = | | popular_vote4 = 64,291 | ||
| percentage4 = | | percentage4 = 23.9% | ||
| | | swing3 = - | ||
| Line 93: | Line 95: | ||
| before_party = National Workers' Alliance | | before_party = National Workers' Alliance | ||
| posttitle = President of Central Shaneville | | posttitle = President of Central Shaneville | ||
| after_election = | | after_election = George Hargrave | ||
| after_party = | | after_party = National Workers' Alliance | ||
}} | }} | ||
| Line 104: | Line 106: | ||
At the start of the campaign trail it was the Liberals on top with what was predicted to be another minority government, pundits predicted a Liberal minority as they were the only party in this term to not have done something controversial. | At the start of the campaign trail it was the Liberals on top with what was predicted to be another minority government, pundits predicted a Liberal minority as they were the only party in this term to not have done something controversial. | ||
The controversial George Hargrave won the election and second term with a minority government by just 1 seat, he also became the first president since Ben Murker in 1920 to win back to back elections. | |||
==Exit Poll== | ==Exit Poll== | ||
| Line 138: | Line 142: | ||
| align=right| - | | align=right| - | ||
|- | |- | ||
! colspan=4 | | ! colspan=4 | NATIONAL WORKERS' ALLIANCE RETAIN MINORITY | ||
|} | |} | ||
| Line 156: | Line 160: | ||
! Of total | ! Of total | ||
! class="unsortable" | | ! class="unsortable" | | ||
|- | |||
| style="text-align:left;" | National Workers' Alliance | |||
| style="background:"#8B4522;"| | |||
| style="text-align:left;" | <small>George Hargrave <br> (Incumbent)</small> | |||
| 56 | |||
| 0.0% | |||
| {{composition bar|56|180|hex=#8B4522}} | |||
| xxx | |||
| 25.6% | |||
| {{percentage bar|25.6|hex=8B4522}} | |||
|- | |- | ||
| style="text-align:left;" | Conservative Party | | style="text-align:left;" | Conservative Party | ||
| style="background:#0087dc"| | | style="background:#0087dc"| | ||
| style="text-align:left;" | <small>James Moore</small> | | style="text-align:left;" | <small>James Moore</small> | ||
| | | 55 | ||
| 0.0% | | 0.0% | ||
| {{composition bar| | | {{composition bar|55|180|hex=#0087dc}} | ||
| xxx | | xxx | ||
| | | 25.3% | ||
| {{percentage bar| | | {{percentage bar|25.3|hex=0087dc}} | ||
|- | |- | ||
| style="text-align:left;" | Liberal Party | | style="text-align:left;" | Liberal Party | ||
| style="background:#ff0000;"| | | style="background:#ff0000;"| | ||
| style="text-align:left;" | <small>Louis Banderas</small> | | style="text-align:left;" | <small>Louis Banderas</small> | ||
| | | 43 | ||
| 0.0% | | 0.0% | ||
| {{composition bar| | | {{composition bar|43|180|hex=#ff0000}} | ||
| xxx | | xxx | ||
| | | 25.1% | ||
| {{percentage bar| | | {{percentage bar|25.1|hex=ff0000}} | ||
|- | |- | ||
| style="text-align:left;" | Progressive Party | | style="text-align:left;" | Progressive Party | ||
| style="background:#228B22;"| | | style="background:#228B22;"| | ||
| style="text-align:left;" | <small>Thomas Valentine</small> | | style="text-align:left;" | <small>Thomas Valentine</small> | ||
| | | 26 | ||
| 0.0% | | 0.0% | ||
| {{composition bar| | | {{composition bar|26|180|hex=#228B22}} | ||
| xxx | | xxx | ||
| | | 23.9% | ||
| {{percentage bar| | | {{percentage bar|23.9|hex=228B22}} | ||
|} | |} | ||
| Line 206: | Line 210: | ||
|barwidth=380px | |barwidth=380px | ||
|bars= | |bars= | ||
{{bar percent| | {{bar percent|National Workers' Alliance|#8B4522|25.6}} | ||
{{bar percent| | {{bar percent|Conservative Party|#0087dc|25.3}} | ||
{{bar percent| | {{bar percent|Liberal Party|#ff0000|25.1}} | ||
{{bar percent| | {{bar percent|Progressive Party|#228B22|23.9}} | ||
}} | }} | ||
Latest revision as of 21:48, 12 November 2021
 | ||||||||||||||||||||||||||||||||||||||||||||||||||||||||||||||||||||||||||||||||||||||
180 seats in the Central Shaneville Parliament (CSP) 91 seats needed for a majority | ||||||||||||||||||||||||||||||||||||||||||||||||||||||||||||||||||||||||||||||||||||||
|---|---|---|---|---|---|---|---|---|---|---|---|---|---|---|---|---|---|---|---|---|---|---|---|---|---|---|---|---|---|---|---|---|---|---|---|---|---|---|---|---|---|---|---|---|---|---|---|---|---|---|---|---|---|---|---|---|---|---|---|---|---|---|---|---|---|---|---|---|---|---|---|---|---|---|---|---|---|---|---|---|---|---|---|---|---|---|
| Turnout | 83.6% | |||||||||||||||||||||||||||||||||||||||||||||||||||||||||||||||||||||||||||||||||||||
| ||||||||||||||||||||||||||||||||||||||||||||||||||||||||||||||||||||||||||||||||||||||
| ||||||||||||||||||||||||||||||||||||||||||||||||||||||||||||||||||||||||||||||||||||||
The 1940 Central Shaneville Presidential election was held on the 11 October 1940.
In 1940 amidst World War 2 - Central Shaneville announced "The Isolation Act" effectively shutting itself off from the outside world until further notice, this made the outcome of the 1940 election very interesting as this would be the last election with the original 180 seat layout of the CSP.
George Hargrave's term is surrounded in mystery after opposition Conservative Party leader John Tait was assassinated in a mysterious hit and run incident which to this day no one knows the identity of the killer with many thinking it was some kind of coup by the NWA to get rid of the opposition - Hargrave ran for re-election to clear his name and promised a full investigation regarding the assassination.
At the start of the campaign trail it was the Liberals on top with what was predicted to be another minority government, pundits predicted a Liberal minority as they were the only party in this term to not have done something controversial.
The controversial George Hargrave won the election and second term with a minority government by just 1 seat, he also became the first president since Ben Murker in 1920 to win back to back elections.
Exit Poll
The Exit Poll took place a week before the election and predicted the following:
| Parties | Seats | Change | |
|---|---|---|---|
| National Workers' Alliance | 42 | - | |
| Liberal Party | 30 | - | |
| Conservative Party | 26 | - | |
| Progressive Party | 26 | - | |
| Undecided | 56 | - | |
| NATIONAL WORKERS' ALLIANCE RETAIN MINORITY | |||
Results
After all electoral districts had been declared, the results were:
| Party | Leader | MLs | Votes | |||||
|---|---|---|---|---|---|---|---|---|
| Of total | Of total | |||||||
| National Workers' Alliance | George Hargrave (Incumbent) |
56 | 0.0% | 56 / 180
|
xxx | 25.6% | 25.6% | |
| Conservative Party | James Moore | 55 | 0.0% | 55 / 180
|
xxx | 25.3% | 25.3% | |
| Liberal Party | Louis Banderas | 43 | 0.0% | 43 / 180
|
xxx | 25.1% | 25.1% | |
| Progressive Party | Thomas Valentine | 26 | 0.0% | 26 / 180
|
xxx | 23.9% | 23.9% | |


