1969 Schoklandic general election: Difference between revisions
Jump to navigation
Jump to search
No edit summary |
No edit summary |
||
| Line 160: | Line 160: | ||
|- | |- | ||
| style="background:#008080;"| | | style="background:#008080;"| | ||
| style="text-align:left;"| Democratic State Party | | style="text-align:left;"| [[Democratic State Party]] | ||
| style="text-align:left;"| DRP | | style="text-align:left;"| DRP | ||
| 1.2% | | 1.2% | ||
Revision as of 11:51, 30 April 2020
| |||||||||||||||||||||||||||||||||||||||||||||||||||||||||||||||||||||||||||||
All 220 seats to the State Assembly 111 seats needed for a majority | |||||||||||||||||||||||||||||||||||||||||||||||||||||||||||||||||||||||||||||
|---|---|---|---|---|---|---|---|---|---|---|---|---|---|---|---|---|---|---|---|---|---|---|---|---|---|---|---|---|---|---|---|---|---|---|---|---|---|---|---|---|---|---|---|---|---|---|---|---|---|---|---|---|---|---|---|---|---|---|---|---|---|---|---|---|---|---|---|---|---|---|---|---|---|---|---|---|---|
| Turnout | 88.4% | ||||||||||||||||||||||||||||||||||||||||||||||||||||||||||||||||||||||||||||
| |||||||||||||||||||||||||||||||||||||||||||||||||||||||||||||||||||||||||||||
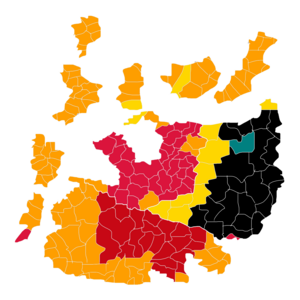
 = Catholic = Socialist = Liberal = Communist = Protestant = Democrat | |||||||||||||||||||||||||||||||||||||||||||||||||||||||||||||||||||||||||||||
| |||||||||||||||||||||||||||||||||||||||||||||||||||||||||||||||||||||||||||||
| 1969 Schoklandic general election | |||||||
|---|---|---|---|---|---|---|---|
| Party | % | Seats | +/– (%pnt) |
+/– (seat) | |||
| Catholic State Party | KRP | 31.6% | 73 | ||||
| Protestant State Party | PRP | 11.7% | 27 | ||||
| Coalition with the Bible | 43.3% | 100 | |||||
| Social Democratic State Party | SDRP | 20.5% | 47 | ||||
| Free Christian State Party | VCRP | 4.4% | 9 | ||||
| Plural left | 24.9% | 56 | |||||
| Liberal State Party | LRP | 15.2% | 31 | ||||
| Democratic State Party | DRP | 1.2% | 2 | ||||
| regionalists | reg. | 0.5% | 1 | ||||
| Liberals, Democrats and Regionalists | 16.9% | 34 | |||||
| Communist State Party | CRP | 14.9% | 25 | ||||
| Southerners (elected on CRP-list) | 5 | ||||||
| Communists + Southerners | 14.9% | 30 | |||||
| Total | 100 | 220 | |||||
Results by region in %
| Region | KRP | PRP | SDRP | LRP | DRP | VCRP | CRP | reg. |
|---|---|---|---|---|---|---|---|---|
| Capital Region | 20.3 | 2.0 | 45.0 | 12.1 | - | 10.6 | 10.0 | - |
| Islands Region | 63.4 | 0.5 | 14.3 | 13.1 | 1.7 | 2.7 | 4.3 | - |
| Eastern Region | 0.2 | 44.4 | 12.9 | 31.2 | 2.8 | 1.1 | 5.2 | 2.1 |
| Southern Region | 42.6 | 0.0 | 9.8 | 4.0 | 0.4 | 3.1 | 40.1 | - |


