Regions of Toubaze: Difference between revisions
mNo edit summary |
mNo edit summary |
||
| Line 2: | Line 2: | ||
| name = Regions of Toubaze | | name = Regions of Toubaze | ||
| alt_name = | | alt_name = | ||
| map = [[File:Toubaze Regions.png| | | map = [[File:Toubaze Regions.png|400px]] | ||
| category = | | category = | ||
| territory = [[Toubaze|Republic of Toubaze]] | | territory = [[Toubaze|Republic of Toubaze]] | ||
Revision as of 20:09, 27 January 2022
| Regions of Toubaze | |
|---|---|
 | |
| Location | Republic of Toubaze |
| Number | 16 |
| Populations | 983,991 (Repon) – 8,003,421 (Ramo) |
| Areas | 8,832 km2 (3,410 sq mi) (Relsessit) – 82,752 km2 (31,951 sq mi) (Nutho) |
| Government | Regional Assembly |
| Subdivisions | Municipality |
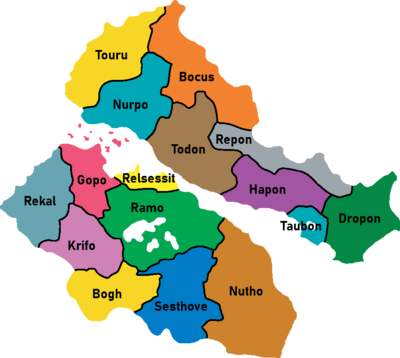
The Regions of Toubaze are they highest administrative division in Toubaze. The 16 regions are further subdivided into 53 municipalities. The current administrative structure was put into effect in 1992 and replaced the system which then included 96 municipalities. The Structure Reform of 1992 merged many of these and established the 16 Regions and their organizational structure and responsibilities.
Regions
The regions are distinct from the central state administration. The regions are responsible for healthcare, environmental supervision, regional roads and public transportation, secondary education and vocational schools, among other. The governing body of a region is the Regional Assembly, which is elected for a four-year term. The Regional Assemblies are headed by Regional Chairmen, who are elected by the Regional Assemblies. This is also the structure for the municipalities, just with Municipal Councils and Mayors instead. For the regional and municipal elections, the voting age is 16.
Region List
All emblems are placeholders

