Mangata (Freedonia): Difference between revisions
No edit summary |
|||
| Line 222: | Line 222: | ||
|year record low F = 27 | |year record low F = 27 | ||
|precipitation colour = green | |precipitation colour = green | ||
| Jan precipitation inch = | | Jan precipitation inch = 5.51 | ||
| Feb precipitation inch = 4.11 | | Feb precipitation inch = 4.11 | ||
| Mar precipitation inch = 3.23 | | Mar precipitation inch = 3.23 | ||
| Line 228: | Line 228: | ||
| May precipitation inch = 3.34 | | May precipitation inch = 3.34 | ||
| Jun precipitation inch = 4.08 | | Jun precipitation inch = 4.08 | ||
| Jul precipitation inch = | | Jul precipitation inch = 5.65 | ||
| Aug precipitation inch = 4.31 | | Aug precipitation inch = 4.31 | ||
| Sep precipitation inch = 3.43 | | Sep precipitation inch = 3.43 | ||
| Oct precipitation inch = 2.48 | | Oct precipitation inch = 2.48 | ||
| Nov precipitation inch = 3.19 | | Nov precipitation inch = 3.19 | ||
| Dec precipitation inch = | | Dec precipitation inch = 4.69 | ||
|year precipitation inch = | |year precipitation inch = | ||
| unit precipitation days = 0.01 in | | unit precipitation days = 0.01 in | ||
Revision as of 02:33, 16 June 2022
Mangata | |
|---|---|
City | |
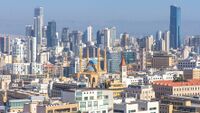
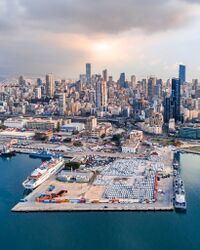
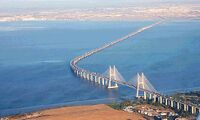
From Top to bottom: Mangata Central City Skyline, Mangata Center City Skyline from the Port of Mangata, The White City of Mangata from above, The White City of Mangata, Armed Forces Blvd, White Cape Blvd, Monent Building (1933), Mangata Hotel (1937), South Cape Park, Bellevue Beach, San Miguel Bay Bridge (2008) | |
| Nickname(s): The White City, City of the South, Cape City | |
| Country | Freedonia |
| Region | Grand Mangata |
| Founded by | James Mangata |
| Government | |
| • Mayor | Jesscia Wholf (PDP) |
| Area | |
| • City | 130 sq mi (300 km2) |
| • Land | 100 sq mi (300 km2) |
| • Water | 30 sq mi (80 km2) |
| • Urban | 80 sq mi (200 km2) |
| • Rural | 20 sq mi (50 km2) |
| Elevation | 337 ft (103 m) |
| Population (2020) | |
| • City | 1,120,000 |
| • Density | 14,000/sq mi (5,000/km2) |
| Population Density based on Municipal Urban Land Area | |
| Demonym | Mangatan |
| Time zone | Freedonia Time |
Mangata is the largest city of Freedonia and capital of Grand Mangata. The city is the famous for its architecture. Spanning from Art Deco to Modern to Brutalist. The city originally founded in 1736 by James Mangata was destroyed during the Freedonian Civil War. After its aftermath, the city was rebuilt between 1910 and 1945. Mangata saw a second building boom starting from 2005 to the present. Two major parks flank the city, South Cape Park and Mangta Urban Green Belt. The Grand Mangata Region is the metropolitan surrounding the city of Mangata. There are multiple modes of transportation in and around the city. The city is Freedonia's most diverse city, and the economic engine of the country. The most popular form of Freedonian music is Bossa Nova. Which is commonly played in the city at jazz bars/clubs and cafes.
History
Geography
WIP
Climate
WIP
| Climate data for Mangata, Grand Mangata, Freedonia, 1991–2020 normals, extremes 1944–present | |||||||||||||
|---|---|---|---|---|---|---|---|---|---|---|---|---|---|
| Month | Jan | Feb | Mar | Apr | May | Jun | Jul | Aug | Sep | Oct | Nov | Dec | Year |
| Record high °F (°C) | 101 (38) |
100 (38) |
99 (37) |
95 (35) |
91 (33) |
88 (31) |
82 (28) |
83 (28) |
86 (30) |
90 (32) |
95 (35) |
98 (37) |
101 (38) |
| Average high °F (°C) | 79 (26) |
78 (26) |
75 (24) |
70 (21) |
66 (19) |
63 (17) |
61 (16) |
62 (17) |
65 (18) |
69 (21) |
74 (23) |
77 (25) |
70 (21) |
| Average low °F (°C) | 65 (18) |
64 (18) |
61 (16) |
56 (13) |
53 (12) |
48 (9) |
45 (7) |
45 (7) |
49 (9) |
53 (12) |
59 (15) |
62 (17) |
55 (13) |
| Record low °F (°C) | 52 (11) |
50 (10) |
46 (8) |
42 (6) |
37 (3) |
32 (0) |
27 (−3) |
29 (−2) |
34 (1) |
39 (4) |
45 (7) |
49 (9) |
27 (−3) |
| Average precipitation inches (mm) | 5.51 (140) |
4.11 (104) |
3.23 (82) |
2.51 (64) |
3.34 (85) |
4.08 (104) |
5.65 (144) |
4.31 (109) |
3.43 (87) |
2.48 (63) |
3.19 (81) |
4.69 (119) |
46.53 (1,182) |
| Average precipitation days (≥ 0.01 in) | 11 | 10 | 9 | 7 | 7 | 9 | 12 | 11 | 9 | 7 | 8 | 10 | 110 |
| Source: Freedonia Weather Service | |||||||||||||
Parks and Gardens
Demographics
| Historical population | ||
|---|---|---|
| Year | Pop. | ±% |
| 1750 | 1,800 | — |
| 1800 | 10,000 | +455.6% |
| 1820 | 30,000 | +200.0% |
| 1830 | 60,000 | +100.0% |
| 1840 | 96,000 | +60.0% |
| 1850 | 192,000 | +100.0% |
| 1898 | 490,000 | +155.2% |
| 1910 | 194,000 | −60.4% |
| 1920 | 340,000 | +75.3% |
| 1930 | 410,000 | +20.6% |
| 1940 | 470,000 | +14.6% |
| 1950 | 546,000 | +16.2% |
| 1960 | 676,000 | +23.8% |
| 1970 | 730,000 | +8.0% |
| 1980 | 810,000 | +11.0% |
| 1990 | 890,000 | +9.9% |
| 2000 | 960,000 | +7.9% |
| 2010 | 1,048,000 | +9.2% |
| 2020 | 1,120,000 | +6.9% |


