1952 Central Shaneville Presidential election
Jump to navigation
Jump to search
 | |||||||||||||||||||||||||||||||||||||||||||||||||||||||||||||||||||||||||||||||||||||||||
264 seats in the Central Shaneville Parliament (CSP) 133 seats needed for a majority | |||||||||||||||||||||||||||||||||||||||||||||||||||||||||||||||||||||||||||||||||||||||||
|---|---|---|---|---|---|---|---|---|---|---|---|---|---|---|---|---|---|---|---|---|---|---|---|---|---|---|---|---|---|---|---|---|---|---|---|---|---|---|---|---|---|---|---|---|---|---|---|---|---|---|---|---|---|---|---|---|---|---|---|---|---|---|---|---|---|---|---|---|---|---|---|---|---|---|---|---|---|---|---|---|---|---|---|---|---|---|---|---|---|
| Turnout | 80% | ||||||||||||||||||||||||||||||||||||||||||||||||||||||||||||||||||||||||||||||||||||||||
| |||||||||||||||||||||||||||||||||||||||||||||||||||||||||||||||||||||||||||||||||||||||||
| |||||||||||||||||||||||||||||||||||||||||||||||||||||||||||||||||||||||||||||||||||||||||
The 1952 Central Shaneville Presidential election was held on the 14 November 1952.
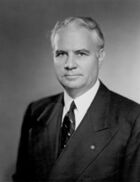
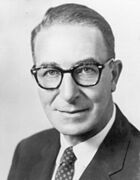
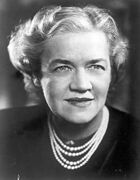
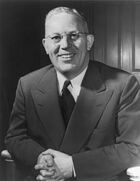
The 1952 campaign trail is once again targeted by the other parties as a way to try and wrestle power away from the Liberals, they were successful in taking away the Liberal majority in 1948 however felt they can go one step further and called out Dunster for his inexperience - Dunster responded by saying that he intended to govern with the same experience and wisdom that had served his party so well in the past.
Exit Poll
The Exit Poll took place a week before the election and predicted the following:
| Parties | Seats | Change | |
|---|---|---|---|
| Liberal Party | 163 | - | |
| Progressive Conservative Party | 54 | - | |
| New Democratic Party | 24 | - | |
| Social Credit Workers' Party | 14 | - | |
| Undecided | 9 | - | |
| LIBERAL PARTY WINS A MAJORITY GOVERNMENT | |||
Results
After all electoral districts had been declared, the results were:
| Party | Leader | MLs | Votes | |||||
|---|---|---|---|---|---|---|---|---|
| Of total | Of total | |||||||
| Progressive Conservative Party | Eric Lomax | 0 | 0.0% | 0 / 264
|
xxx | 0.0 | 0.0% | |
| Liberal Party | John Dunster (Incumbent) |
0 | 0.0% | 0 / 264
|
xxx | 0.0%' | 0.0% | |
| New Democratic Party | Margaret MacMillan | 0 | 0.0% | 0 / 264
|
xxx | 0.0% | 0.0% | |
| Social Credit Workers' Party | John Foster | 0 | 0.0% | 0 / 264
|
xxx | 0.0% | 0.0% | |


