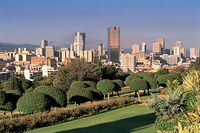
Bella Costa (Freedonia)
Jump to navigation
Jump to search
Bella Costa | |
|---|---|
Capital City, Autonomous City | |
From Top to bottom: Bella Costa CBD Bella Costa City Hall, Freedonian Parliament Palace, Royal Palace of Bella Costa, Metropolitan Cathedral of Bella Costa, Freedonia National Museum of Art | |
| Nickname(s): The Capital, City of Coffee | |
| Country | Freedonia |
| Region | North Sutherland |
| Government | |
| • Mayor | Sophia Swason (FNC) |
| Area | |
| • Total | 36 sq mi (90 km2) |
| • Land | 30 sq mi (80 km2) |
| • Water | 6 sq mi (20 km2) |
| Elevation | 337 ft (103 m) |
| Population (2022)540,000 people live in the Saint Francis- Bella Costa Metropolitain Area | |
| • Total | 540,000 |
| • Density | 1,800/sq mi (700/km2) |
| Population Density based on City Land Area | |
| Demonym | Bella Costan |
| Time zone | Freedonia Time |
WIP
History
Geography
WIP
Climate
| Climate data for Bella Costa,North Sutherland, Freedonia, 1991–2020 normals, extremes 1944–present | |||||||||||||
|---|---|---|---|---|---|---|---|---|---|---|---|---|---|
| Month | Jan | Feb | Mar | Apr | May | Jun | Jul | Aug | Sep | Oct | Nov | Dec | Year |
| Record high °F (°C) | 101 (38) |
99 (37) |
93 (34) |
86 (30) |
81 (27) |
77 (25) |
74 (23) |
74 (23) |
78 (26) |
84 (29) |
90 (32) |
95 (35) |
101 (38) |
| Average high °F (°C) | 84 (29) |
84 (29) |
80 (27) |
74 (23) |
70 (21) |
68 (20) |
65 (18) |
66 (19) |
69 (21) |
73 (23) |
77 (25) |
81 (27) |
74 (24) |
| Average low °F (°C) | 66 (19) |
66 (19) |
63 (17) |
57 (14) |
52 (11) |
48 (9) |
47 (8) |
48 (9) |
52 (11) |
56 (13) |
60 (16) |
64 (18) |
57 (14) |
| Record low °F (°C) | 48 (9) |
49 (9) |
45 (7) |
42 (6) |
39 (4) |
35 (2) |
32 (0) |
32 (0) |
35 (2) |
37 (3) |
42 (6) |
45 (7) |
32 (0) |
| Average precipitation inches (mm) | 3.43 (87) |
3.19 (81) |
2.63 (67) |
2.34 (59) |
2.11 (54) |
2.28 (58) |
2.48 (63) |
2.31 (59) |
2.08 (53) |
2.41 (61) |
2.72 (69) |
3.04 (77) |
31.02 (788) |
| Average precipitation days (≥ 0.01 in) | 13 | 12 | 11 | 10 | 9 | 10 | 9 | 8 | 10 | 11 | 12 | 13 | 128 |
| Source: Freedonia Weather Service | |||||||||||||
Parks and Gardens
Demographics
| Historical population | ||
|---|---|---|
| Year | Pop. | ±% |
| 1830 | 7,000 | — |
| 1840 | 5,000 | −28.6% |
| 1850 | 9,000 | +80.0% |
| 1878 | 33,000 | +266.7% |
| 1882 | 38,000 | +15.2% |
| 1910 | 51,000 | +34.2% |
| 1920 | 68,000 | +33.3% |
| 1930 | 87,000 | +27.9% |
| 1932 | 91,000 | +4.6% |
| 1939 | 99,000 | +8.8% |
| 1958 | 128,000 | +29.3% |
| 1978 | 92,000 | −28.1% |
| 1992 | 81,000 | −12.0% |
| 2002 | 65,000 | −19.8% |
| 2015 | 54,000 | −16.9% |


