1985 Schoklandic general election
Jump to navigation
Jump to search
| |||||||||||||||||||||||||||||||||||||||||||||||||||||||||||||||||||||||||||||
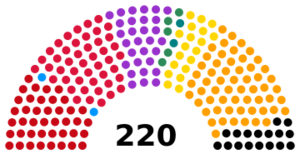
All 220 seats to the State Assembly 111 seats needed for a majority | |||||||||||||||||||||||||||||||||||||||||||||||||||||||||||||||||||||||||||||
|---|---|---|---|---|---|---|---|---|---|---|---|---|---|---|---|---|---|---|---|---|---|---|---|---|---|---|---|---|---|---|---|---|---|---|---|---|---|---|---|---|---|---|---|---|---|---|---|---|---|---|---|---|---|---|---|---|---|---|---|---|---|---|---|---|---|---|---|---|---|---|---|---|---|---|---|---|---|
| Turnout | 88.7% | ||||||||||||||||||||||||||||||||||||||||||||||||||||||||||||||||||||||||||||
| |||||||||||||||||||||||||||||||||||||||||||||||||||||||||||||||||||||||||||||
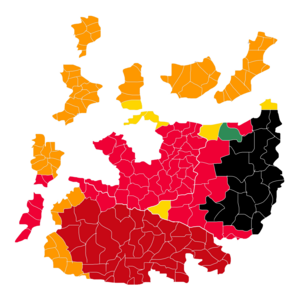
 = Catholic = Socialist = Liberal = Communist = Protestant = regionalist | |||||||||||||||||||||||||||||||||||||||||||||||||||||||||||||||||||||||||||||
| |||||||||||||||||||||||||||||||||||||||||||||||||||||||||||||||||||||||||||||

| |||||||
|---|---|---|---|---|---|---|---|
| 1985 Schoklandic general election | |||||||
| Party | % | Seats | +/– (%pnt) |
+/– (seat) | |||
| Social Democratic State Party | SDRP | 29.2% | 65 | ||||
| Communist State Party | CRP | 18.4% | 34 | ||||
| Caucus'70 | F'70 | 3.3% | 7 | ||||
| Southerners | 9 [1] | ||||||
| Plural left | 50.9% | 115 | |||||
| Catholic State Party | KRP | 23.1% | 51 | ||||
| National Bloc | NB | 1.3% | 2 | ||||
| Plural Right | 24.4% | 53 | |||||
| Liberal State Party | LRP | 10.7% | 21 | ||||
| regionalists | reg. | 2.8% | 6 | ||||
| Democratic State Party | DRP | 1.6% | 3 | ||||
| Liberals, Democrats and Regionalists | 15.1% | 30 | |||||
| Protestant State Party | PRP | 8.9% | 22 | ||||
| Free Christian State Party | VCRP | 0.7% | 0 | ||||
| Alternative'85 | A'85 | 0.1% | 0 | New | New | ||
| Others | 0.1% | 0 | |||||
| Total | 100 | 220 | |||||
Results by state in %
| State | SDRP | KRP | CRP | LRP | PRP | F'70 | reg. | DRP | NB |
|---|---|---|---|---|---|---|---|---|---|
| Capital State | 54.4 | 10.7 | 15.1 | 13.8 | 0.5 | 3.6 | - | - | 0.4 |
| State of Islands | 25.9 | 50.4 | 5.3 | 8.0 | 0.2 | 3.2 | - | 3.8 | 2.3 |
| Eastern State | 25.1 | - | 3.1 | 16.9 | 34.6 | 6.1 | 11.2 | 3.6 | 0.6 |
| Southern State | 11.3 | 31.3 | 50.0 | 3.9 | 0.2 | 0.2 | - | 0.6 | 1.9 |


