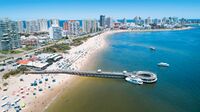
Dream City (Freedonia)
Jump to navigation
Jump to search
Dream City | |
|---|---|
City State/Region | |
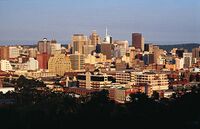
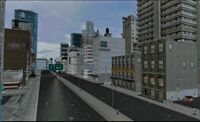
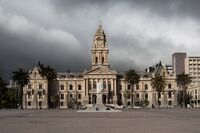
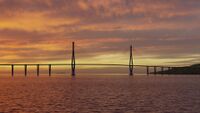
From Top to bottom: South Metro Skyline, South Metro Skyline from South Metro Marina, Market Boulevard, Yuantown, Dream City Skylink (opened 2022), Sunny Beach | |
| Nickname(s): City of Progress, City of Dreams, Star City | |
| Country | Freedonia |
| Region | Dream City |
| Government | |
| • Executive Mayor | Dan Pelto (PDP) |
| Area | |
| • City State/Region | 691 sq mi (1,790 km2) |
| • Land | 257 sq mi (670 km2) |
| • Water | 434 sq mi (1,120 km2) |
| • Urban | 75 sq mi (190 km2) |
| • Rural | 182 sq mi (470 km2) |
| Elevation | 120 ft (40 m) |
| Population (2022) | |
| • City State/Region | 210,000 |
| • Density | 2,800/sq mi (1,100/km2) |
| Population Density based on City Land Area | |
| Demonym | Dream Citizen |
| Time zone | Freedonia Time |
Dream City is the second largest city and only city-state (region) of Freedonia.
History
Geography
WIP
Climate
WIP
| Climate data for Dream City, Freedonia, 1991–2020 normals, extremes 1944–present | |||||||||||||
|---|---|---|---|---|---|---|---|---|---|---|---|---|---|
| Month | Jan | Feb | Mar | Apr | May | Jun | Jul | Aug | Sep | Oct | Nov | Dec | Year |
| Record high °F (°C) | 106 (41) |
104 (40) |
101 (38) |
97 (36) |
93 (34) |
86 (30) |
83 (28) |
84 (29) |
88 (31) |
94 (34) |
99 (37) |
102 (39) |
106 (41) |
| Average high °F (°C) | 90 (32) |
89 (32) |
86 (30) |
80 (27) |
77 (25) |
75 (24) |
72 (22) |
72 (22) |
76 (24) |
81 (27) |
87 (31) |
90 (32) |
81 (27) |
| Average low °F (°C) | 73 (23) |
72 (22) |
68 (20) |
65 (18) |
59 (15) |
54 (12) |
50 (10) |
50 (10) |
53 (12) |
60 (16) |
64 (18) |
69 (21) |
61 (16) |
| Record low °F (°C) | 63 (17) |
60 (16) |
57 (14) |
54 (12) |
47 (8) |
40 (4) |
37 (3) |
39 (4) |
43 (6) |
49 (9) |
55 (13) |
58 (14) |
37 (3) |
| Average precipitation inches (mm) | 12.23 (311) |
10.09 (256) |
9.47 (241) |
3.18 (81) |
2.98 (76) |
2.13 (54) |
2.28 (58) |
2.16 (55) |
2.95 (75) |
3.23 (82) |
9.42 (239) |
10.93 (278) |
71.05 (1,806) |
| Average precipitation days (≥ 0.01 in) | 22 | 21 | 18 | 13 | 11 | 8 | 10 | 9 | 7 | 11 | 18 | 20 | 168 |
| Source 1: Freedonia Weather Service | |||||||||||||
| Source 2: Dream City Observatory | |||||||||||||
Parks and Gardens
Demographics
| Historical population | ||
|---|---|---|
| Year | Pop. | ±% |
| 1830 | 250 | — |
| 1840 | 400 | +60.0% |
| 1850 | 1,000 | +150.0% |
| 1878 | 5,000 | +400.0% |
| 1882 | 10,000 | +100.0% |
| 1910 | 21,000 | +110.0% |
| 1920 | 32,000 | +52.4% |
| 1930 | 45,000 | +40.6% |
| 1932 | 43,000 | −4.4% |
| 1939 | 38,000 | −11.6% |
| 1958 | 30,000 | −21.1% |
| 1978 | 52,000 | +73.3% |
| 1992 | 68,000 | +30.8% |
| 2002 | 75,000 | +10.3% |
| 2015 | 78,000 | +4.0% |
