1946 Elizean general election|
|
| Opinion polls |
| Turnout | 90.15% |
|---|
|
|
First party
|
Second party
|
Third party
|
|
|
|

|

|
| Leader
|
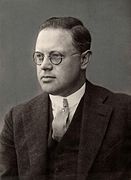
Charles Ooijth
|
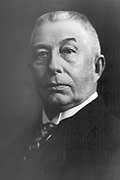
Jozef Krul
|
Pieter Peterson
|
| Party
|
Union of Rightists
|
Socialist
|
UD
|
| Leader's seat
|
Capital District
|
Capital District
|
Kraailande
|
| Last election
|
109 seats, 28.8%
|
27 seats, 7.8%
|
93 seats, 25.4%
|
| Seats won
|
110
|
71
|
66
|
| Seat change
|
 1 1
|
44
|
 27 27
|
| Percentage
|
28.6%
|
19.1%
|
19.0%
|
| Swing
|
0.2
|
11.3
|
6.4
|
|
|
|
Fourth party
|
Fifth party
|
Sixth party
|
|
|

|

|

|
| Leader
|
Klaas Huis
|
Dolf Tusali
|
Henk Hofland
|
| Party
|
Liberal Union
|
Nationalist Union
|
Communist Party Elizea
|
| Leader's seat
|
Konijnenveld
|
Capital District
|
Zoutevelde
|
| Last election
|
48 seats, 13.8%
|
37 seats, 10.7%
|
15 seats, 4.4%
|
| Seats won
|
45
|
16
|
16
|
| Seat change
|
3
|
21
|
1
|
| Percentage
|
13.0%
|
4.7%
|
4.6%
|
| Swing
|
0.8
|
6.0
|
0.2
|
|
|
|
Seventh party
|
Eighth party
|
Ninth party
|
|
|

|

|
|
| Leader
|
Charlie Van der Zee
|
Joost Langreep
|
Doede Istra
|
| Party
|
Free-thinking Radicals
|
DC
|
Frisian Voters' Association
|
| Leader's seat
|
Capital District
|
Sankto Anna
|
Boksum-Litersum
|
| Last election
|
17 seats, 4.8%
|
did not exist
|
did not exist
|
| Seats won
|
15
|
14
|
7
|
| Seat change
|
2
|
N/A
|
N/A
|
| Percentage
|
4.3%
|
4.0%
|
2.0%
|
| Swing
|
0.5
|
N/A
|
N/A
|
|
The Socialist Party made massive gains. The social liberal Democratic Union and the far-right Nationalist Union both lost a lot of seats. Two new parties entered the parliament the Christian Democracy and the Frisian Voters.
Although the vote share of the Frisian Voters' Association (2.0%) was below the 3% electoral threshold, due to its status of being representative of a recognised minority group (Frisians), an exception in law allowed the party to win seats.
| Party | Votes | % | Seats | +/– |
|---|
| Union of Rightists | 2,860,000 | 28.61 | 110 | – |
| Socialist Party | 1,910,000 | 19.10 | 71 | – |
| Democratic Union | 1,900,000 | 19.00 | 66 | – |
| Liberal Union | 1,300,000 | 13.00 | 45 | – |
| Nationalist Union | 470,000 | 4.70 | 16 | – |
| Communist Party | 460,000 | 4.60 | 16 | – |
| Free-thinking Radicals | 430,000 | 4.30 | 15 | – |
| Christian Democracy | 400,000 | 4.00 | 14 | New |
| Frisian Voters' Association | 200,000 | 2.00 | 7 | New |
| others | 68,063 | 0.68 | 0 | – |
| Total | 9,998,063 | 100.00 | 360 | 0 |
|
| Valid votes | 9,998,063 | 99.98 | |
|---|
| Invalid/blank votes | 1,937 | 0.02 | |
|---|
| Total votes | 10,000,000 | 100.00 | |
|---|
| Registered voters/turnout | 11,093,186 | 90.15 | |
|---|

.jpg)

.jpg)

,_Bestanddeelnr_920-1109.jpg)
.jpg)

.jpg)