1988 Central Shaneville Presidential election: Difference between revisions
No edit summary |
No edit summary |
||
| (3 intermediate revisions by the same user not shown) | |||
| Line 12: | Line 12: | ||
| election_date = {{Start date|1988|11|11|df=y}} | | election_date = {{Start date|1988|11|11|df=y}} | ||
| next_election = | | next_election = | ||
| next_year = 1992 | | next_year = [[1992 Central Shaneville Presidential election|1992]] | ||
| next_mps = | | next_mps = | ||
| seats_for_election= 264 seats in the Central Shaneville Parliament (CSP) | | seats_for_election= 264 seats in the Central Shaneville Parliament (CSP) | ||
| Line 22: | Line 22: | ||
<!-- Liberal --> | <!-- Liberal --> | ||
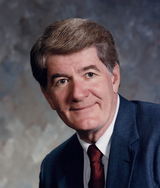
| image1 = [[File: Michael_Duffy.png|160px]] | | image1 = [[File: Michael_Duffy.png|160px]] | ||
| leader1 = Michael Duffy | | leader1 = '''Michael Duffy''' | ||
| colour1 = ff0000 | | colour1 = ff0000 | ||
| party1 = Liberal Party | | party1 = '''Liberal Party''' | ||
| alliance1 = | | alliance1 = | ||
| leader_since1 = November 1988 | | leader_since1 = '''November 1988'''' | ||
| last_election1 = 3,422,787 (41.3%) | | last_election1 = '''3,422,787 (41.3%)''' | ||
| seats_before1 = | | seats_before1 = '''111''' | ||
| seats1 = | | seats1 = '''157''' | ||
| seat_change1 = | | seat_change1 = '''+46''' | ||
| popular_vote1 = | | popular_vote1 = '''3,716,772''' | ||
| percentage1 = | | percentage1 = '''44.4%''' | ||
| swing1 = - | | swing1 = - | ||
| Line 44: | Line 44: | ||
| leader_since2 = February 1986 | | leader_since2 = February 1986 | ||
| last_election2 = 2,450,187 (29.6%) | | last_election2 = 2,450,187 (29.6%) | ||
| seats_before2 = | | seats_before2 = 72 | ||
| seats2 = | | seats2 = 72 | ||
| seat_change2 = | | seat_change2 = 0 | ||
| popular_vote2 = | | popular_vote2 = 2,482,113 | ||
| percentage2 = | | percentage2 = 29.6% | ||
| swing2 = - | | swing2 = - | ||
| Line 60: | Line 60: | ||
| leader_since3 = January 1977 | | leader_since3 = January 1977 | ||
| last_election3 = 1,837,985 (22.2%) | | last_election3 = 1,837,985 (22.2%) | ||
| seats_before3 = | | seats_before3 = 58 | ||
| seats3 = | | seats3 = 21 | ||
| seat_change3 = - | | seat_change3 = -37 | ||
| popular_vote3 = | | popular_vote3 = 1,636,748 | ||
| percentage3 = | | percentage3 = 19.5% | ||
| swing3 = - | | swing3 = - | ||
| Line 76: | Line 76: | ||
| leader_since4 = November 1988 | | leader_since4 = November 1988 | ||
| last_election4 = 567,371 (6.9%) | | last_election4 = 567,371 (6.9%) | ||
| seats_before4 = | | seats_before4 = 23 | ||
| seats4 = | | seats4 = 14 | ||
| seat_change4 = - | | seat_change4 = -9 | ||
| popular_vote4 = | | popular_vote4 = 548,068 | ||
| percentage4 = | | percentage4 = 6.5% | ||
| swing4 = - | | swing4 = - | ||
| Line 90: | Line 90: | ||
| before_party = Liberal Party | | before_party = Liberal Party | ||
| posttitle = President of Central Shaneville | | posttitle = President of Central Shaneville | ||
| after_election = | | after_election = Michael Duffy | ||
| after_party = | | after_party = Liberal Party | ||
}} | }} | ||
| Line 105: | Line 105: | ||
A new regulation in Parliament abolishes of "Leader seats" to make voting more open and less biased in the districts where the party leaders are from. | A new regulation in Parliament abolishes of "Leader seats" to make voting more open and less biased in the districts where the party leaders are from. | ||
After the election was called, the Liberals and Michael Duffy win a majority meaning that the people of Central Shaneville clearly wanted to give Duffy a chance to redeem the Liberal Party after the scandals of the second term of Tom Johnson. | |||
==Exit Poll== | ==Exit Poll== | ||
| Line 113: | Line 115: | ||
! style="vertical-align:top;" |Seats | ! style="vertical-align:top;" |Seats | ||
! style="vertical-align:top;" |Change | ! style="vertical-align:top;" |Change | ||
|- | |||
| bgcolor="#ff0000" | | |||
|Liberal Party | |||
| style="text-align:right;" |135 | |||
| align=right| - | |||
|- | |- | ||
| bgcolor="#0087dc" | | | bgcolor="#0087dc" | | ||
|Progressive Conservative Party | |Progressive Conservative Party | ||
| style="text-align:right;" | | | style="text-align:right;" |52 | ||
| align=right| - | | align=right| - | ||
|- | |- | ||
| bgcolor="#FF6A00" | | | bgcolor="#FF6A00" | | ||
|New Democratic Party | |New Democratic Party | ||
| style="text-align:right;" | | | style="text-align:right;" |42 | ||
| align=right| - | | align=right| - | ||
|- | |- | ||
| bgcolor=."#116468" | | | bgcolor=."#116468" | | ||
|Social Credit Workers' Party | |Social Credit Workers' Party | ||
| style="text-align:right;" | | | style="text-align:right;" |16 | ||
| align=right| - | |||
|- | |||
| | |||
|Undecided | |||
| style="text-align:right;" |17 | |||
| align=right| - | | align=right| - | ||
|- | |- | ||
! colspan=4 | | ! colspan=4 | LIBERAL PARTY WINS A MAJORITY GOVERNMENT | ||
|} | |} | ||
| Line 156: | Line 163: | ||
| style="background:#ff0000;"| | | style="background:#ff0000;"| | ||
| style="text-align:left;" | <small>Michael Duffy</small> | | style="text-align:left;" | <small>Michael Duffy</small> | ||
| | | 157 | ||
| 0.0% | | 0.0% | ||
| {{composition bar| | | {{composition bar|157|264|hex=#ff0000}} | ||
| xxx | | xxx | ||
| | | 44.4% | ||
| {{percentage bar| | | {{percentage bar|44.4|hex=ff0000}} | ||
|- | |- | ||
| style="text-align:left;" | Progressive Conservative Party | | style="text-align:left;" | Progressive Conservative Party | ||
| style="background:#0087dc"| | | style="background:#0087dc"| | ||
| style="text-align:left;" | <small>Peter Smith</small> | | style="text-align:left;" | <small>Peter Smith</small> | ||
| | | 72 | ||
| 0.0% | | 0.0% | ||
| {{composition bar| | | {{composition bar|72|264|hex=#0087dc}} | ||
| xxx | | xxx | ||
| | | 29.6% | ||
| {{percentage bar| | | {{percentage bar|29.6|hex=0087dc}} | ||
|- | |- | ||
| style="text-align:left;" | New Democratic Party | | style="text-align:left;" | New Democratic Party | ||
| style="background:#FF6A00;"| | | style="background:#FF6A00;"| | ||
| style="text-align:left;" | <small>Harry Grocer</small> | | style="text-align:left;" | <small>Harry Grocer</small> | ||
| | | 21 | ||
| 0.0% | | 0.0% | ||
| {{composition bar| | | {{composition bar|21|264|hex=#FF6A00}} | ||
| xxx | | xxx | ||
| | | 19.5% | ||
| {{percentage bar| | | {{percentage bar|19.5|hex=FF6A00}} | ||
|- | |- | ||
| style="text-align:left;" | Social Credit Workers' Party | | style="text-align:left;" | Social Credit Workers' Party | ||
| style="background:"#116468;"| | | style="background:"#116468;"| | ||
| style="text-align:left;" | <small>Lydie Poulson</small> | | style="text-align:left;" | <small>Lydie Poulson</small> | ||
| | | 14 | ||
| 0.0% | | 0.0% | ||
| {{composition bar| | | {{composition bar|14|264|hex=#116468}} | ||
| xxx | | xxx | ||
| | | 6.5% | ||
| {{percentage bar| | | {{percentage bar|6.5|hex=116468}} | ||
|} | |} | ||
| Line 202: | Line 209: | ||
|barwidth=380px | |barwidth=380px | ||
|bars= | |bars= | ||
{{bar percent|Liberal Party|#ff0000| | {{bar percent|Liberal Party|#ff0000|44.4}} | ||
{{bar percent|Conservative Party|#0087dc| | {{bar percent|Conservative Party|#0087dc|29.6}} | ||
{{bar percent|New Democratic Party|#FF6A00| | {{bar percent|New Democratic Party|#FF6A00|19.5}} | ||
{{bar percent|Social Credit Workers' Party|#116468| | {{bar percent|Social Credit Workers' Party|#116468|6.5}} | ||
}} | }} | ||
Latest revision as of 19:25, 27 November 2021
 | ||||||||||||||||||||||||||||||||||||||||||||||||||||||||||||||||||||||||||||||||||
264 seats in the Central Shaneville Parliament (CSP) 133 seats needed for a majority | ||||||||||||||||||||||||||||||||||||||||||||||||||||||||||||||||||||||||||||||||||
|---|---|---|---|---|---|---|---|---|---|---|---|---|---|---|---|---|---|---|---|---|---|---|---|---|---|---|---|---|---|---|---|---|---|---|---|---|---|---|---|---|---|---|---|---|---|---|---|---|---|---|---|---|---|---|---|---|---|---|---|---|---|---|---|---|---|---|---|---|---|---|---|---|---|---|---|---|---|---|---|---|---|---|
| Turnout | 85% | |||||||||||||||||||||||||||||||||||||||||||||||||||||||||||||||||||||||||||||||||
| ||||||||||||||||||||||||||||||||||||||||||||||||||||||||||||||||||||||||||||||||||
| ||||||||||||||||||||||||||||||||||||||||||||||||||||||||||||||||||||||||||||||||||
The 1988 Central Shaneville Presidential election was held on the 11 November 1988. Tom Johnson and the Liberal Party was the incumbent president and party respectively.
Johnson's second term was marked by many scandals, the most prominent is the "Sibyl Vane affair", Vane was a well known author and close friend of Johnson's, she was appointed the Governor of the Bank of Central Shaneville by Johnson in 1985, but she is caught having an affair with Tom Johnson and is later revealed to have been sleeping with her as well - In January 1986, Parliament calls for a vote of no-confidence against President Johnson, on the day of the vote, the House of Representatives is sitting on a motion to adjourn, which was brought forward by the Speaker of the House, Bruce Fitch.
The vote is carried out and Johnson is the only one who votes against the adjournment, many believe he will resign however his position was becoming increasingly difficult and resigns ahead of the 1988 election after Parliament kept him in charge yet they stripped him of all presidential power between 1986 and 1988, making him the first president to be impeached in Central Shaneville history.
Replacing the scandalous President Tom Johnson, the Liberal Party's 1988 candidate is a young politician called Michael Duffy, he is seen as a breath of fresh air by many, whilst others see him as a carpetbagger in true Liberal fashion.
This election also saw the first "Communist" candidate with Lydie Poulson running for President however the rest of the communist world outside of Central Shaneville during the time called Poulson "a fake communist" whilst the Social Credit Party never brought this up hoping it wouldn't affect their results knowing all this drama could effect their results in the election.
A new regulation in Parliament abolishes of "Leader seats" to make voting more open and less biased in the districts where the party leaders are from.
After the election was called, the Liberals and Michael Duffy win a majority meaning that the people of Central Shaneville clearly wanted to give Duffy a chance to redeem the Liberal Party after the scandals of the second term of Tom Johnson.
Exit Poll
The Exit Poll took place a week before the election and predicted the following:
| Parties | Seats | Change | |
|---|---|---|---|
| Liberal Party | 135 | - | |
| Progressive Conservative Party | 52 | - | |
| New Democratic Party | 42 | - | |
| Social Credit Workers' Party | 16 | - | |
| Undecided | 17 | - | |
| LIBERAL PARTY WINS A MAJORITY GOVERNMENT | |||
Results
After all electoral districts had been declared, the results were:
| Party | Leader | MLs | Votes | |||||
|---|---|---|---|---|---|---|---|---|
| Of total | Of total | |||||||
| Liberal Party | Michael Duffy | 157 | 0.0% | 157 / 264
|
xxx | 44.4% | 44.4% | |
| Progressive Conservative Party | Peter Smith | 72 | 0.0% | 72 / 264
|
xxx | 29.6% | 29.6% | |
| New Democratic Party | Harry Grocer | 21 | 0.0% | 21 / 264
|
xxx | 19.5% | 19.5% | |
| Social Credit Workers' Party | Lydie Poulson | 14 | 0.0% | 14 / 264
|
xxx | 6.5% | 6.5% | |


