1984 Central Shaneville Presidential election
 | |||||||||||||||||||||||||||||||||||||||||||||||||||||||||||||||||||||||||||||||||||||||||
264 seats in the Central Shaneville Parliament (CSP) 133 seats needed for a majority | |||||||||||||||||||||||||||||||||||||||||||||||||||||||||||||||||||||||||||||||||||||||||
|---|---|---|---|---|---|---|---|---|---|---|---|---|---|---|---|---|---|---|---|---|---|---|---|---|---|---|---|---|---|---|---|---|---|---|---|---|---|---|---|---|---|---|---|---|---|---|---|---|---|---|---|---|---|---|---|---|---|---|---|---|---|---|---|---|---|---|---|---|---|---|---|---|---|---|---|---|---|---|---|---|---|---|---|---|---|---|---|---|---|
| Turnout | 85% | ||||||||||||||||||||||||||||||||||||||||||||||||||||||||||||||||||||||||||||||||||||||||
| |||||||||||||||||||||||||||||||||||||||||||||||||||||||||||||||||||||||||||||||||||||||||
| |||||||||||||||||||||||||||||||||||||||||||||||||||||||||||||||||||||||||||||||||||||||||
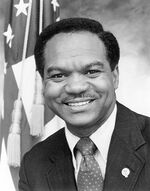
The 1984 Central Shaneville Presidential election was held on the 9 November 1984. Tom Johnson and the Liberal Party are the incumbent president and party respectively.
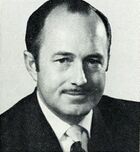
Johnson's first term as President was seen by many as a great success, and it seems that he has finally managed to win the people over from the NDP and the old guard of the Liberal party who had turned against him before he could prove himself - this election would be a direct rematch from the 1980 election with the same candidates running.
Tom Johnson retains his presidency however he only wins a minority with the Conservatives gaining ground again meaning the Liberal's loose control over the government continues.
Exit Poll
The Exit Poll took place a week before the election and predicted the following:
| Parties | Seats | Change | |
|---|---|---|---|
| Liberal Party | 148 | - | |
| Progressive Conservative Party | 51 | - | |
| New Democratic Party | 32 | - | |
| Social Credit Workers' Party | 22 | - | |
| Undecided | 11 | - | |
| LIBERAL PARTY RETAINS A MAJORITY GOVERNMENT | |||
Results
After all electoral districts had been declared, the results were:
| Party | Leader | MLs | Votes | |||||
|---|---|---|---|---|---|---|---|---|
| Of total | Of total | |||||||
| Liberal Party | Tom Johnson (incumbent) |
111 | 0.0% | 111 / 264
|
xxx | 41.3%' | 41.3% | |
| Progressive Conservative Party | John Marcus Perkins | 72 | 0.0% | 72 / 264
|
xxx | 29.6 | 29.6% | |
| New Democratic Party | Aaron Hoskins | 58 | 0.0% | 58 / 264
|
xxx | 22.2% | 22.2% | |
| Social Credit Workers' Party | Harry Grocer | 23 | 0.0% | 23 / 264
|
xxx | 6.9% | 6.9% | |


