1956 Central Shaneville Presidential election: Difference between revisions
Jump to navigation
Jump to search
No edit summary |
|||
| Line 10: | Line 10: | ||
| previous_year = [[1952 Central Shaneville Presidential election|1952]] | | previous_year = [[1952 Central Shaneville Presidential election|1952]] | ||
| previous_mps = | | previous_mps = | ||
| election_date = {{Start date| | | election_date = {{Start date|1956|11|9|df=y}} | ||
| next_election = | | next_election = | ||
| next_year = 1960 | | next_year = 1960 | ||
| Line 20: | Line 20: | ||
<!-- Conservatives --> | <!-- Conservatives --> | ||
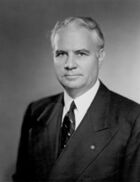
| image1 = | | image1 = [[File:Eric_Lomax.jpg|140px]] | ||
| leader1 = | | leader1 = Eric Lomax | ||
| leaders_seat1 = | | leaders_seat1 = Bastia | ||
| colour1 = 0087dc | | colour1 = 0087dc | ||
| party1 = | | party1 = Conservative-Social Credit Coalition | ||
| alliance1 = | | alliance1 = | ||
| leader_since1 = | | leader_since1 = January 1948 | ||
| last_election1 = | | last_election1 = 2,130,630 (25.4%) | ||
| seats_before1 = | | seats_before1 = 69 | ||
| seats1 = - | | seats1 = - | ||
| seat_change1 = - | | seat_change1 = - | ||
| Line 37: | Line 37: | ||
<!-- Liberal --> | <!-- Liberal --> | ||
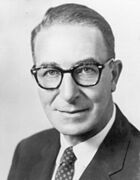
| image2 = | | image2 = [[File:John_Dunster.jpg|140px]] | ||
| leader2 = | | leader2 = John Dunster | ||
| leaders_seat2 = | | leaders_seat2 = Sassari | ||
| colour2 = ff0000 | | colour2 = ff0000 | ||
| party2 = Liberal Party | | party2 = Liberal Party | ||
| alliance2 = | | alliance2 = | ||
| leader_since2 = | | leader_since2 = August 1949 | ||
| last_election2 = | | last_election2 = 3,939,904 (47.0%) | ||
| seats_before2 = | | seats_before2 = 145 | ||
| seats2 = - | | seats2 = - | ||
| seat_change2 = - | | seat_change2 = - | ||
| Line 54: | Line 54: | ||
<!-- Progressive --> | <!-- Progressive --> | ||
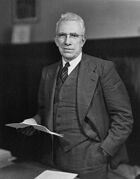
| image3 = | | image3 = [[File:Jean Chrétien CSV.jpg|140px]] | ||
| leader3 = | | leader3 = Jean Chrétien | ||
| leaders_seat3 = | | leaders_seat3 = Corte | ||
| colour3 = FF6A00 | | colour3 = FF6A00 | ||
| party3 = New Democratic Party | | party3 = New Democratic Party | ||
| alliance3 = | | alliance3 = | ||
| leader_since3 = | | leader_since3 = April 1953 | ||
| last_election3 = | | last_election3 = 1,720,634 (20.5%) | ||
| seats_before3 = | | seats_before3 = 31 | ||
| seats3 = - | | seats3 = - | ||
| seat_change3 = - | | seat_change3 = - | ||
| Line 71: | Line 71: | ||
<!-- Social Credit --> | <!-- Social Credit --> | ||
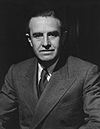
| image4 = | | image4 = [[File:William_Fieldhouse.jpg|140px]] | ||
| leader4 = | | leader4 = William Fieldhouse | ||
| leaders_seat4 = | | leaders_seat4 = Centrale | ||
| colour4 = 116468 | | colour4 = 116468 | ||
| party4 = Social Credit | | party4 = Conservative-Social Credit Coalition | ||
| alliance4 = | | alliance4 = | ||
| leader_since4 = | | leader_since4 = January 1954 | ||
| last_election4 = | | last_election4 = 491,586 (5.9%) | ||
| seats_before4 = | | seats_before4 = 19 | ||
| seats4 = - | | seats4 = - | ||
| seat_change4 = - | | seat_change4 = - | ||
Revision as of 12:51, 16 November 2021
 | |||||||||||||||||||||||||||||||||||||||||||||||||||||||||||||||||||||||||||||||||||||||||
264 seats in the Central Shaneville Parliament (CSP) 133 seats needed for a majority | |||||||||||||||||||||||||||||||||||||||||||||||||||||||||||||||||||||||||||||||||||||||||
|---|---|---|---|---|---|---|---|---|---|---|---|---|---|---|---|---|---|---|---|---|---|---|---|---|---|---|---|---|---|---|---|---|---|---|---|---|---|---|---|---|---|---|---|---|---|---|---|---|---|---|---|---|---|---|---|---|---|---|---|---|---|---|---|---|---|---|---|---|---|---|---|---|---|---|---|---|---|---|---|---|---|---|---|---|---|---|---|---|---|
| Turnout | 83% | ||||||||||||||||||||||||||||||||||||||||||||||||||||||||||||||||||||||||||||||||||||||||
| |||||||||||||||||||||||||||||||||||||||||||||||||||||||||||||||||||||||||||||||||||||||||
| |||||||||||||||||||||||||||||||||||||||||||||||||||||||||||||||||||||||||||||||||||||||||
The 1956 Central Shaneville Presidential election was held on the 9 November 1956.
Exit Poll
The Exit Poll took place a week before the election and predicted the following:
| Parties | Seats | Change | ||
|---|---|---|---|---|
| Conservative/Social Credit Coalition | Progressive Conservative Party | 0 | - | |
| Social Credit Workers' Party | 0 | - | ||
| Liberal Party | 0 | - | ||
| New Democratic Party | 0 | - | ||
| TBD | ||||
Results
After all electoral districts had been declared, the results were:
| Party | Leader | MLs | Votes | ||||||
|---|---|---|---|---|---|---|---|---|---|
| Of total | Of total | ||||||||
| Conservative-Social Credit Coalition | Progressive Conservative Party | TBD | 0 | 0.0% | 0 / 264
|
xxx | 0.0 | 0.0% | |
| Social Credit Workers' Party | TBD | 0 | 0.0% | 0 / 264
|
xxx | 0.0% | 0.0% | ||
| Other parties | Liberal Party | TBD | 0 | 0.0% | 0 / 264
|
xxx | 0.0%' | 0.0% | |
| New Democratic Party | TBD | 0 | 0.0% | 0 / 264
|
xxx | 0.0% | 0.0% | ||


