Hartridge (Freedonia): Difference between revisions
Jump to navigation
Jump to search
| Line 163: | Line 163: | ||
| 1932 | 38,456 | | 1932 | 38,456 | ||
| 1942 | 74,098 | | 1942 | 74,098 | ||
| 1952 | 101,520 | |||
| 1962 | 158,768 | |||
| 1972 | 166,778 | |||
| 1982 | 178,983 | |||
| 1992 | 206,033 | |||
| 2002 | 253,962 | |||
| 2012 | 279,063 | |||
| 2022 | 310,008 | |||
}} | }} | ||
Revision as of 22:12, 26 March 2022
Hartridge | |
|---|---|
City-County/ Regional Capital | |
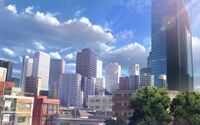
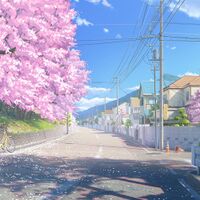
From Top to bottom: Hartridge CBD (Downtown Hartridge), Spring River Neighborhood, Spring River Neighborhood during a rainstorm, Highland Lake Recreational Area during the day, Highland Lake Recreational Area during the night, Hartridge Botanical Gardens, Hartridge Central High School, Hartridge University campus, Residential street in the Flowerland Neighborhood, Hartridge Forest Park | |
| Nickname(s): Spring City, Garden City, City by the Lake | |
| Country | Freedonia |
| Region | Southland |
| Founded by | Cornell Hartridge |
| Government | |
| • Mayor | Sophia Swason (GSP) |
| Area | |
| • City-County/ Regional Capital | 780 sq mi (2,000 km2) |
| • Land | 730 sq mi (1,900 km2) |
| • Water | 50 sq mi (100 km2) |
| • Urban | 130 sq mi (300 km2) |
| • Rural | 600 sq mi (2,000 km2) |
| • Metro | 1,600 sq mi (4,000 km2) |
| Elevation | 2,300 ft (700 m) |
| Population (2022) | |
| • City-County/ Regional Capital | 310,000 |
| • Density | 2,384.62/sq mi (920.71/km2) |
| Population Density based on Urban Area | |
| Demonym | Hartridgeain |
| Time zone | Freedonia Time |
Hartridge also known as Hartridge City is the largest city and capital of Southland. It is the nation's third largest city. Hartridge is known for its natural beauty, lake shore, mountain, and forest views. Hartridge University is located in the city. Hartridge has a population as of the 2022 census, of 310,000 people.
History
Geography
Climate
Parks and Gardens
Demographics
| Historical population | ||
|---|---|---|
| Year | Pop. | ±% |
| 1882 | 129 | — |
| 1892 | 568 | +340.3% |
| 1902 | 2,604 | +358.5% |
| 1912 | 5,758 | +121.1% |
| 1922 | 18,756 | +225.7% |
| 1932 | 38,456 | +105.0% |
| 1942 | 74,098 | +92.7% |
| 1952 | 101,520 | +37.0% |
| 1962 | 158,768 | +56.4% |
| 1972 | 166,778 | +5.0% |
| 1982 | 178,983 | +7.3% |
| 1992 | 206,033 | +15.1% |
| 2002 | 253,962 | +23.3% |
| 2012 | 279,063 | +9.9% |
| 2022 | 310,008 | +11.1% |


