Hartridge (Freedonia): Difference between revisions
Jump to navigation
Jump to search
No edit summary |
|||
| Line 220: | Line 220: | ||
|year record low F = | |year record low F = | ||
|precipitation colour = green | |precipitation colour = green | ||
| Jan precipitation inch = | | Jan precipitation inch = 5.67 | ||
| Feb precipitation inch = | | Feb precipitation inch = 5.23 | ||
| Mar precipitation inch = | | Mar precipitation inch = 4.42 | ||
| Apr precipitation inch = 3.12 | | Apr precipitation inch = 3.12 | ||
| May precipitation inch = 2.56 | | May precipitation inch = 2.56 | ||
| Jun precipitation inch = | | Jun precipitation inch = 1.18 | ||
| Jul precipitation inch = | | Jul precipitation inch = 0.43 | ||
| Aug precipitation inch = | | Aug precipitation inch = 0.98 | ||
| Sep precipitation inch = | | Sep precipitation inch = 1.98 | ||
| Oct precipitation inch = 3. | | Oct precipitation inch = 3.38 | ||
| Nov precipitation inch = | | Nov precipitation inch = 4.29 | ||
| Dec precipitation inch = | | Dec precipitation inch = 5.15 | ||
|year precipitation inch = | |year precipitation inch = | ||
| unit precipitation days = 0.01 in | | unit precipitation days = 0.01 in | ||
| Jan precipitation days = 16 | | Jan precipitation days = 16 | ||
| Feb precipitation days = 15 | | Feb precipitation days = 15 | ||
| Mar precipitation days = | | Mar precipitation days = 13 | ||
| Apr precipitation days = 10 | | Apr precipitation days = 10 | ||
| May precipitation days = 9 | | May precipitation days = 9 | ||
| Jun precipitation days = | | Jun precipitation days = 4 | ||
| Jul precipitation days = | | Jul precipitation days = 3 | ||
| Aug precipitation days = | | Aug precipitation days = 4 | ||
| Sep precipitation days = | | Sep precipitation days = 7 | ||
| Oct precipitation days = 10 | | Oct precipitation days = 10 | ||
| Nov precipitation days = | | Nov precipitation days = 12 | ||
| Dec precipitation days = | | Dec precipitation days = 14 | ||
| year precipitation days = | | year precipitation days = | ||
|Jan snow inch = | |Jan snow inch = | ||
Revision as of 04:31, 27 March 2022
Hartridge | |
|---|---|
City-County/ Regional Capital | |
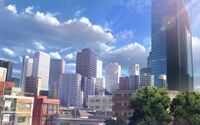
From Top to bottom: Hartridge CBD (Downtown Hartridge), Spring River Neighborhood, Spring River Neighborhood during a rainstorm, Highland Lake Recreational Area during the day, Highland Lake Recreational Area during the night, Hartridge Botanical Gardens, Hartridge Central High School, Hartridge University campus, Residential street in the Flowerland Neighborhood, Hartridge Forest Park | |
| Nickname(s): Spring City, Garden City, City by the Lake | |
| Country | Freedonia |
| Region | Southland |
| Founded by | Cornell Hartridge |
| Government | |
| • Mayor | Sophia Swason (GSP) |
| Area | |
| • City-County/ Regional Capital | 670 sq mi (1,700 km2) |
| • Land | 542 sq mi (1,400 km2) |
| • Water | 128 sq mi (330 km2) |
| • Urban | 162 sq mi (420 km2) |
| • Rural | 380 sq mi (1,000 km2) |
| • Metro | 3,600 sq mi (9,000 km2) |
| Elevation | 2,600 ft (800 m) |
| Population (2022) | |
| • City-County/ Regional Capital | 192,000 |
| • Density | 1,185.86/sq mi (457.86/km2) |
| Population Density based on Urban Area | |
| Demonym | Hartridgeain |
| Time zone | Freedonia Time |
Hartridge also known as Hartridge City is the largest city and capital of Southland. It is the nation's third largest city. Hartridge is known for its natural beauty, lake shore, mountain, and forest views. Hartridge University is located in the city. Hartridge has a population as of the 2022 census, of 192,000 people.
History
Geography
Climate
| Climate data for Downtown Hartridge, Southland, Freedonia, 1991–2020 normals, extremes 1944–present | |||||||||||||
|---|---|---|---|---|---|---|---|---|---|---|---|---|---|
| Month | Jan | Feb | Mar | Apr | May | Jun | Jul | Aug | Sep | Oct | Nov | Dec | Year |
| Record high °F (°C) | 93 (34) |
90 (32) |
86 (30) |
83 (28) |
80 (27) |
77 (25) |
74 (23) |
76 (24) |
79 (26) |
82 (28) |
86 (30) |
89 (32) |
93 (34) |
| Average high °F (°C) | 77 (25) |
77 (25) |
74 (23) |
71 (22) |
67 (19) |
63 (17) |
60 (16) |
60 (16) |
62 (17) |
65 (18) |
68 (20) |
73 (23) |
68 (20) |
| Average low °F (°C) | 60 (16) |
57 (14) |
54 (12) |
51 (11) |
48 (9) |
45 (7) |
42 (6) |
44 (7) |
48 (9) |
52 (11) |
56 (13) |
59 (15) |
51 (11) |
| Record low °F (°C) | 48 (9) |
45 (7) |
40 (4) |
37 (3) |
32 (0) |
27 (−3) |
18 (−8) |
21 (−6) |
28 (−2) |
35 (2) |
42 (6) |
46 (8) |
18 (−8) |
| Average precipitation inches (mm) | 5.67 (144) |
5.23 (133) |
4.42 (112) |
3.12 (79) |
2.56 (65) |
1.18 (30) |
0.43 (11) |
0.98 (25) |
1.98 (50) |
3.38 (86) |
4.29 (109) |
5.15 (131) |
38.39 (975) |
| Average precipitation days (≥ 0.01 in) | 16 | 15 | 13 | 10 | 9 | 4 | 3 | 4 | 7 | 10 | 12 | 14 | 117 |
| Source: Freedonia Weather Service | |||||||||||||
Parks and Gardens
Demographics
| Historical population | ||
|---|---|---|
| Year | Pop. | ±% |
| 1900 | 72,560 | — |
| 1902 | 77,498 | +6.8% |
| 1912 | 101,289 | +30.7% |
| 1922 | 128,756 | +27.1% |
| 1932 | 147,510 | +14.6% |
| 1942 | 164,098 | +11.2% |
| 1952 | 177,456 | +8.1% |
| 1962 | 192,338 | +8.4% |
| 1972 | 207,810 | +8.0% |
| 1982 | 227,063 | +9.3% |
| 1992 | 248,789 | +9.6% |
| 2002 | 263,568 | +5.9% |
| 2012 | 294,760 | +11.8% |
| 2022 | 310,025 | +5.2% |


