Mespalian general election, 2019: Difference between revisions
Jump to navigation
Jump to search
No edit summary |
No edit summary |
||
| Line 118: | Line 118: | ||
The '''2019 [[Mespalia]]n general election''' was held on Sunday, 7 May 2019, with all Mespalian citizens over the age of 21 being entitled to vote to elect members of the [[Parliament of Mespalia#General Assembly|General Assembly]], the lower house of the Parliament of Mespalia. | The '''2019 [[Mespalia]]n general election''' was held on Sunday, 7 May 2019, with all Mespalian citizens over the age of 21 being entitled to vote to elect members of the [[Parliament of Mespalia#General Assembly|General Assembly]], the lower house of the Parliament of Mespalia. | ||
All 350 members of the General Assembly were elected using {{wpl|open-list proportional representation}} from | All 350 members of the General Assembly were elected using {{wpl|open-list proportional representation}} from 44 constituencies that elect between three and twelve assemblymembers. | ||
==Results== | ==Results== | ||
Latest revision as of 19:58, 12 July 2019
| |||||||||||||||||||||||||||||||||||||||||||||||||||||||||||||
350 seats in the General Assembly of Mespalia 176 seats needed for a majority | |||||||||||||||||||||||||||||||||||||||||||||||||||||||||||||
|---|---|---|---|---|---|---|---|---|---|---|---|---|---|---|---|---|---|---|---|---|---|---|---|---|---|---|---|---|---|---|---|---|---|---|---|---|---|---|---|---|---|---|---|---|---|---|---|---|---|---|---|---|---|---|---|---|---|---|---|---|---|
| Turnout | 76.8% ( | ||||||||||||||||||||||||||||||||||||||||||||||||||||||||||||
| |||||||||||||||||||||||||||||||||||||||||||||||||||||||||||||
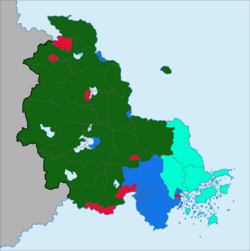
 Largest party by constituency | |||||||||||||||||||||||||||||||||||||||||||||||||||||||||||||
The 2019 Mespalian general election was held on Sunday, 7 May 2019, with all Mespalian citizens over the age of 21 being entitled to vote to elect members of the General Assembly, the lower house of the Parliament of Mespalia.
All 350 members of the General Assembly were elected using open-list proportional representation from 44 constituencies that elect between three and twelve assemblymembers.
Results
| Party | Votes | % | Seats | +/– | ||
|---|---|---|---|---|---|---|
| Social Democratic Workers' Party | 1,555,172 | 26.1 | 97 | |||
| Conservative Party | 1,507,504 | 25.3 | 90 | |||
| People's Party | 1,251,287 | 21.0 | 73 | |||
| Patriotic League | 506,473 | 8.5 | 27 | |||
| Party of the Aininian Minority | 363,469 | 6.1 | 22 | |||
| The Greens | 405,178 | 6.8 | 21 | |||
| Liberal Party | 268,133 | 4.5 | 12 | |||
| Socialist Left Party | 220,465 | 3.7 | 8 | |||
| Freedom Party | 53,626 | 0.9 | 0 | |||
| Nationalist Alternative | 17,875 | 0.3 | 0 | |||
| Communist Party | 11,917 | 0.2 | 0 | |||
| Independentist Coalition | 8,760 | 0.2 | 0 | |||
| Independents | 5,145 | 0.1 | 0 | |||
| Invalid/blank votes | 49,866 | – | – | – | ||
| Total | 6,224,870 | 100 | 350 | |||
By constituency
| Province | Constituency | Seats | |||||||||||
|---|---|---|---|---|---|---|---|---|---|---|---|---|---|
| Cârinmâ | Cârinmâ | ||||||||||||
| Cârivezi | |||||||||||||
| Cæizenvirta | Cæizenvirta Pochiainen | ||||||||||||
| Cæizenvirta Etelæinen | |||||||||||||
| Vylævasqué | |||||||||||||
| Emæsalo | Emæsalo | ||||||||||||
| Iouzzene | Iouzzene Etelæinen | ||||||||||||
| Iouzzene Laczi | |||||||||||||
| Iouzzene Pochiainen | |||||||||||||
| Iouzzene Quesqui | |||||||||||||
| Iouzzene Vôxenlâchi | |||||||||||||
Aftermath
After the results were released, incumbent Minister of State Caleva Tœlaczi admitted defeat and asked Social Democratic Party chairman Voitto Ræchqué to form the next government.


