1996 Central Shaneville Presidential election
 | ||||||||||||||||||||||||||||||||||||||||||||||||||||||||||||||||||||||||||||||||||
301 seats in the Central Shaneville Parliament (CSP) 151 seats needed for a majority | ||||||||||||||||||||||||||||||||||||||||||||||||||||||||||||||||||||||||||||||||||
|---|---|---|---|---|---|---|---|---|---|---|---|---|---|---|---|---|---|---|---|---|---|---|---|---|---|---|---|---|---|---|---|---|---|---|---|---|---|---|---|---|---|---|---|---|---|---|---|---|---|---|---|---|---|---|---|---|---|---|---|---|---|---|---|---|---|---|---|---|---|---|---|---|---|---|---|---|---|---|---|---|---|---|
| Turnout | 67% | |||||||||||||||||||||||||||||||||||||||||||||||||||||||||||||||||||||||||||||||||
| ||||||||||||||||||||||||||||||||||||||||||||||||||||||||||||||||||||||||||||||||||
| ||||||||||||||||||||||||||||||||||||||||||||||||||||||||||||||||||||||||||||||||||
The 1996 Central Shaneville Presidential election was held on the 8 November 1996. Michael Duffy and the Liberal Party were incumbent President and political party respectively, this election also saw more parliamentary reforms with six more seats being added to the CSP following Duffy's plan to get more people to vote, this didn't work however as the 1996 election is almost infamous now a days for its incredibly low turnout.
Even though the election had one of the lowest turnouts in history, it was also one of the closest in Central Shaneville history with Duffy and the Liberals retaining power but only with a minority government.
Exit Poll
The Exit Poll took place a week before the election and predicted the following:
| Parties | Seats | Change | |
|---|---|---|---|
| Liberal Party | 137 | - | |
| Reform Party | 59 | - | |
| Progressive Conservative Party | 45 | - | |
| Green Party | 28 | - | |
| New Democratic Party | 20 | - | |
| Undecided | 9 | - | |
| LIBERAL PARTY WINS A MINORITY GOVERNMENT | |||
Results
After all electoral districts had been declared, the results were:
| Party | Leader | MLs | Votes | |||||
|---|---|---|---|---|---|---|---|---|
| Of total | Of total | |||||||
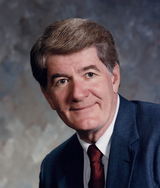
| Liberal Party | Michael Duffy (Incumbent) |
114 | 0.0% | 114 / 301
|
xxx | 32.5% | 32.5% | |
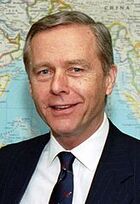
| Reform Party | Joe Clark | 65 | 0.0% | 65 / 301
|
xxx | 21.6% | 21.6% | |
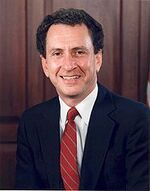
| Progressive Conservative Party | James Carville | 54 | 0.0% | 54 / 301
|
xxx | 19.0% | 19.0% | |
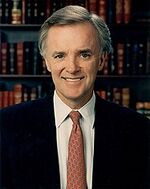
| New Democratic Party | Paul Martin | 34 | 0.0% | 34 / 301
|
xxx | 15.2% | 15.2% | |
| Green Party | Caroline Lucas | 34 | 0.0% | 34 / 301
|
xxx | 11.6% | 11.6% | |
