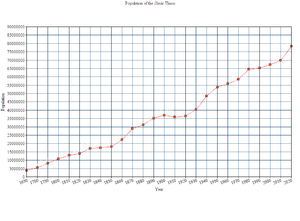
Demographic history of the Slavic Union
This article is about the demographic history of the Slavic Union.
Historical Census population
2020: 78,277,904- 10.8% increase
2010: 69,823,890- 3.7% increase
2000: 67,240,406- 2.9% increase
1990: 65,290,343- 1.2% increase
1980: 64,506,949- 9.3% increase
1970: 58,507,803- 4.6% increase
1960: 55,816,444- 3.5% increase
1950: 53,862,868- 10% increase
1940: 48,476,581- 16.6% increase
1930: 40,429,469- 10.1% increase
1920: 36,346,092- 1.5% increase
1910: 35,800,901- 3.5% decrease
1900: 37,053,932- 5% increase
1890: 35,201,236- 11.1% increase
1880: 31,293,899- 7.5% increase
1870: 28,946,856- 23.2% increase
1860: 22,231,185- 18.3% increase
1850: 18,162,878- 3.6% increase
1840: 17,509,015- 2.2% increase
1830: 17,123,816- 18% increase
1820: 14,041,529- 7.9% increase
1810: 12,932,249- 16.1% increase
1800: 10,850,156- 24% increase
1750: 8,246,118- 33.7% increase
1700: 5,467,176- 26.8% increase
1650: 4,001,973
Population by ethnic group
| Group | Year | |
|---|---|---|
| Number | % | |
| Slavic | 61,291,598 | 78.3% |
| Ledyanayan | 8,767,125 | 11.2% |
| Rettoan | 2,896,282 | 3.7% |
| Parabocan | 1,565,562 | 2% |
| Gladysynthian | 1,330,724 | 1.7% |
| Kleshonian | 1,174,168 | 1.5% |
| Stassan | 547,945 | 0.7% |
| Lissathan | 391,389 | 0.5% |
| Koblecian | 313,111 | 0.4% |
