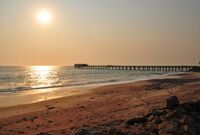
Saint Francis (Freedonia)
Jump to navigation
Jump to search
Saint Francis | |
|---|---|
City-County/ Regional Capital | |
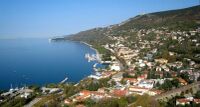
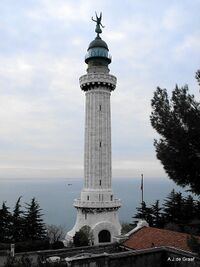
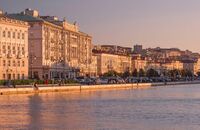
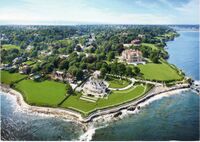
From Top to bottom: Queens Beach Neighborhood, Saint Francis Vita Lighthouse, Saint Francis Downtown Waterfront, Summer Royal Castle, Bellevue Neighborhood, Saint Francis Harbor Bridge, Gilded Beach | |
| Nickname(s): Riveria City, Classical City | |
| Country | Freedonia |
| Region | North Sutherland |
| Government | |
| • Mayor | Dan Pelto (PDP) |
| Area | |
| • Total | 25 sq mi (60 km2) |
| • Land | 20 sq mi (50 km2) |
| • Water | 5 sq mi (10 km2) |
| Elevation | 337 ft (103 m) |
| Population (2015)540,000 people live in the Saint Francis-Bella Costa Metropolitan Area | |
| • Total | 78,000 |
| • Density | 3,900/sq mi (1,500/km2) |
| Population Density based on City Land Area | |
| Demonym | Saint Franciscan |
| Time zone | Freedonia Time |
Saint Francis is the largest city and capital of North Sutherland.
History
Geography
WIP
Climate
WIP
| Climate data for Saint Francis, North Sutherland, Freedonia, 1991–2020 normals, extremes 1944–present | |||||||||||||
|---|---|---|---|---|---|---|---|---|---|---|---|---|---|
| Month | Jan | Feb | Mar | Apr | May | Jun | Jul | Aug | Sep | Oct | Nov | Dec | Year |
| Record high °F (°C) | 101 (38) |
104 (40) |
99 (37) |
92 (33) |
86 (30) |
80 (27) |
77 (25) |
77 (25) |
82 (28) |
88 (31) |
93 (34) |
98 (37) |
104 (40) |
| Average high °F (°C) | 83 (28) |
82 (28) |
79 (26) |
76 (24) |
72 (22) |
67 (19) |
63 (17) |
64 (18) |
68 (20) |
73 (23) |
79 (26) |
81 (27) |
74 (23) |
| Average low °F (°C) | 68 (20) |
66 (19) |
62 (17) |
58 (14) |
52 (11) |
48 (9) |
45 (7) |
45 (7) |
49 (9) |
53 (12) |
59 (15) |
63 (17) |
56 (13) |
| Record low °F (°C) | 52 (11) |
50 (10) |
46 (8) |
42 (6) |
37 (3) |
32 (0) |
27 (−3) |
29 (−2) |
34 (1) |
39 (4) |
45 (7) |
49 (9) |
27 (−3) |
| Average precipitation inches (mm) | 7.23 (184) |
6.09 (155) |
5.47 (139) |
2.18 (55) |
1.98 (50) |
2.13 (54) |
2.28 (58) |
2.16 (55) |
1.95 (50) |
2.23 (57) |
5.42 (138) |
6.93 (176) |
46.05 (1,171) |
| Average precipitation days (≥ 0.01 in) | 18 | 17 | 15 | 8 | 7 | 8 | 10 | 9 | 7 | 9 | 15 | 17 | 140 |
| Source: Freedonia Weather Service | |||||||||||||
Parks and Gardens
Demographics
| Historical population | ||
|---|---|---|
| Year | Pop. | ±% |
| 1830 | 250 | — |
| 1840 | 400 | +60.0% |
| 1850 | 1,000 | +150.0% |
| 1878 | 5,000 | +400.0% |
| 1882 | 10,000 | +100.0% |
| 1910 | 21,000 | +110.0% |
| 1920 | 32,000 | +52.4% |
| 1930 | 45,000 | +40.6% |
| 1932 | 43,000 | −4.4% |
| 1939 | 38,000 | −11.6% |
| 1958 | 30,000 | −21.1% |
| 1978 | 52,000 | +73.3% |
| 1992 | 68,000 | +30.8% |
| 2002 | 75,000 | +10.3% |
| 2015 | 78,000 | +4.0% |
