User:Lyonsland/sandbox
Jump to navigation
Jump to search
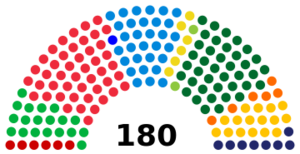
Results
Preliminary results were finalised on the morning of 4 September, and the official result was published on 8 September.
| Party | Votes | % | Seats | +/– | |
|---|---|---|---|---|---|
| Socialist Labour Party | 1,663,651 | 20.95 | 46 | ||
| National People's Party | 1,482,170 | 18.67 | 39 | ||
| Progressive Democratic Party | 1,153,511 | 14.53 | 31 | ||
| Green Party | 806,166 | 10.16 | 19 | ||
| Heart of Hennehouwe | 681,576 | 8.58 | 16 | New | |
| Patriot's March | 474,588 | 5.98 | 8 | ||
| The Left | 380,010 | 4.79 | 6 | ||
| People's Party for Sotirian Democracy | 334,576 | 4.21 | 6 | 0 | |
| Party for the Petois | 239,031 | 3.01 | 6 | 0 | |
| Agrarian–Farmer's Party | 234,590 | 2.95 | 2 | ||
| Vox Hennehouwe | 138,642 | 1.75 | 1 | New | |
| Red Party | 93,152 | 1.18 | 0 | New | |
| LIVE – The Liberal Union | 90,628 | 1.14 | 0 | ||
| Vive le Petois | 27,529 | 0.34 | 0 | New | |
| Catholic Labour Party | 19,019 | 0.24 | 0 | 0 | |
| Oopsie Woopsie Party | 16,681 | 0.21 | 0 | 0 | |
| Future Hennehouwe | 16,279 | 0.21 | 0 | 0 | |
| The V Party | 15,132 | 0.19 | 0 | 0 | |
| Sotirian Confessional Union | 10,689 | 0.13 | 0 | 0 | |
| Sustainable Hennehouwe | 10,627 | 0.13 | 0 | New | |
| Green Conservatives | 8,287 | 0.10 | 0 | New | |
| Independent Hennish Section of the Workers' International | 7,561 | 0.10 | 0 | 0 | |
| Party for the Senior Citizens | 6,575 | 0.08 | 0 | 0 | |
| Basic Income Party | 6,415 | 0.08 | 0 | New | |
| For Freedom | 5,456 | 0.07 | 0 | New | |
| Liberal Party | 4,378 | 0.06 | 0 | 0 | |
| Dermaux List | 3,943 | 0.05 | 0 | New | |
| Hennish Brotherhood | 3,425 | 0.04 | 0 | 0 | |
| Direct Democracy Now | 2,032 | 0.03 | 0 | 0 | |
| The 99% – For The Many | 1,631 | 0.02 | 0 | New | |
| Spiritus | 674 | 0.01 | 0 | New | |
| Total | 7,940,354 | 100.00 | 180 | 0 | |
| Valid votes | 7,940,354 | 99.49 | |||
| Invalid/blank votes | 40,976 | 0.51 | |||
| Total votes cast | 7,981,330 | 100.00 | |||
| Registered voters/turnout | 9,792,234 | 81.51 | |||
| Source: Verkiezingscommissie | |||||
