Akashian general election, 1950
Jump to navigation
Jump to search
| |||||||||||||||||||||||||||||||||||||||||||||||||||||||||||||||||||||||||||||
200 seats in the National Assembly 101 seats needed for a majority | |||||||||||||||||||||||||||||||||||||||||||||||||||||||||||||||||||||||||||||
|---|---|---|---|---|---|---|---|---|---|---|---|---|---|---|---|---|---|---|---|---|---|---|---|---|---|---|---|---|---|---|---|---|---|---|---|---|---|---|---|---|---|---|---|---|---|---|---|---|---|---|---|---|---|---|---|---|---|---|---|---|---|---|---|---|---|---|---|---|---|---|---|---|---|---|---|---|---|
| Turnout | 84,7% | ||||||||||||||||||||||||||||||||||||||||||||||||||||||||||||||||||||||||||||
| |||||||||||||||||||||||||||||||||||||||||||||||||||||||||||||||||||||||||||||
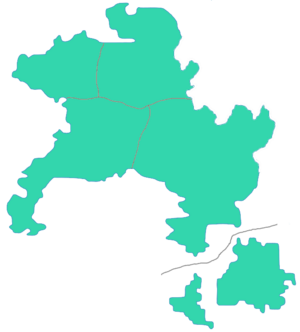
 Most voted party by province | |||||||||||||||||||||||||||||||||||||||||||||||||||||||||||||||||||||||||||||
| |||||||||||||||||||||||||||||||||||||||||||||||||||||||||||||||||||||||||||||
A general election was held in Akashi on 24 June 1950. The incumbent Yurika Ehara government was re-elected with a majority.
The election was notable for the debut of the National Democratic Party, and the Workers' Party surpassing the electoral threshold and entering the National Assembly. The Social Credit Party, meanwhile, fell short of the threshold after narrowly crossing it four years before, and lost all their MNAs.
Results
| General election, 24 June 1950 | ||||||
|---|---|---|---|---|---|---|

| ||||||
| Party | Votes | % | +/− | Seats | +/− | |
| National Union | 1.229.653 | 51,5% | +0,5% | 108 | +1 | |
| Socialist Party | 248.318 | 10,4% | +0,2% | 22 | +1 | |
| National Cooperative Party | 207.728 | 8,7% | -0,8% | 18 | -2 | |
| Liberal Party | 159.974 | 6,7% | -0,8% | 14 | -2 | |
| Agrarian Party | 143.261 | 6,0% | -1,0% | 12 | -3 | |
| National Democratic Party | 97.895 | 4,1% | +4,1% | 8 | +8 | |
| Communist Party | 83.569 | 3,5% | -0,7% | 7 | -2 | |
| Workers' Party | 71.630 | 3,0% | +0,3% | 6 | +6 | |
| Social Credit Party | 52.529 | 2,2% | -0,6% | 0 | -6 | |
| Conservative National Party | 35.815 | 1,5% | -1,0% | 0 | ±0 | |
| Independents | 57.304 | 2,4% | -0,2% | 5 | -1 | |
| Total | 2.387.676 | 100% | — | 200 | — | |
| Registered voters and turnout | 2.818.980 | 84,7% | ||||
- Government: National Union majority.


