Fyedor: Difference between revisions
(added more?) |
(→Climate: added climate table) |
||
| Line 92: | Line 92: | ||
===Neighbourhoods=== | ===Neighbourhoods=== | ||
===Climate=== | ===Climate=== | ||
{{Weather box | |||
|location = [[Fyedor]] ([[Henri Þapmann International Airport]]) <br/> 1981−2010 normals, extremes 1941−present | |||
|metric first = Y | |||
|single line = Y | |||
|Jan maximum humidex = 13.5 | |||
|Feb maximum humidex = 14.7 | |||
|Mar maximum humidex = 28.0 | |||
|Apr maximum humidex = 33.8 | |||
|May maximum humidex = 40.9 | |||
|Jun maximum humidex = 45.0 | |||
|Jul maximum humidex = 45.8 | |||
|Aug maximum humidex = 46.8 | |||
|Sep maximum humidex = 42.8 | |||
|Oct maximum humidex = 33.5 | |||
|Nov maximum humidex = 26.2 | |||
|Dec maximum humidex = 18.1 | |||
|year maximum humidex = 46.8 | |||
|Jan record high C = 13.9 | |||
|Feb record high C = 15.0 | |||
|Mar record high C = 25.8 | |||
|Apr record high C = 30.0 | |||
|May record high C = 36.6 | |||
|Jun record high C = 35.0 | |||
|Jul record high C = 35.6 | |||
|Aug record high C = 37.6 | |||
|Sep record high C = 33.5 | |||
|Oct record high C = 28.3 | |||
|Nov record high C = 24.3 | |||
|Dec record high C = 18.0 | |||
|year record high C = 37.6 | |||
|Jan high C = -5.3 | |||
|Feb high C = -3.2 | |||
|Mar high C = 2.5 | |||
|Apr high C = 11.6 | |||
|May high C = 18.9 | |||
|Jun high C = 23.9 | |||
|Jul high C = 26.3 | |||
|Aug high C = 25.3 | |||
|Sep high C = 20.6 | |||
|Oct high C = 13.0 | |||
|Nov high C = 5.9 | |||
|Dec high C = -1.4 | |||
|year high C = 11.5 | |||
|Jan mean C = −9.7 | |||
|Feb mean C = −7.7 | |||
|Mar mean C = −2.0 | |||
|Apr mean C = 6.4 | |||
|May mean C = 13.4 | |||
|Jun mean C = 18.6 | |||
|Jul mean C = 21.2 | |||
|Aug mean C = 20.1 | |||
|Sep mean C = 15.5 | |||
|Oct mean C = 8.5 | |||
|Nov mean C = 2.1 | |||
|Dec mean C = -5.4 | |||
|year mean C = 6.8 | |||
|Jan low C = -14.0 | |||
|Feb low C = -12.2 | |||
|Mar low C = -6.5 | |||
|Apr low C = 1.2 | |||
|May low C = 7.9 | |||
|Jun low C = 13.2 | |||
|Jul low C = 16.1 | |||
|Aug low C = 14.8 | |||
|Sep low C = 10.3 | |||
|Oct low C = 3.9 | |||
|Nov low C = -1.7 | |||
|Dec low C = -9.3 | |||
|year low C = 2.0 | |||
|Jan record low C = -37.8 | |||
|Feb record low C = -33.9 | |||
|Mar record low C = -29.4 | |||
|Apr record low C = -15.0 | |||
|May record low C = -4.4 | |||
|Jun record low C = 0.0 | |||
|Jul record low C = 6.1 | |||
|Aug record low C = 3.3 | |||
|Sep record low C = -2.2 | |||
|Oct record low C = -7.2 | |||
|Nov record low C = -19.4 | |||
|Dec record low C = -32.4 | |||
|year record low C = -37.8 | |||
|Jan chill = -49.1 | |||
|Feb chill = -46.0 | |||
|Mar chill = -42.9 | |||
|Apr chill = -26.3 | |||
|May chill = -9.9 | |||
|Jun chill = 0.0 | |||
|Jul chill = 0.0 | |||
|Aug chill = 0.0 | |||
|Sep chill = -4.8 | |||
|Oct chill = -10.9 | |||
|Nov chill = -30.7 | |||
|Dec chill = -46.0 | |||
|year chill = -49.1 | |||
|precipitation colour = green | |||
|Jan precipitation mm = 77.2 | |||
|Feb precipitation mm = 62.7 | |||
|Mar precipitation mm = 69.1 | |||
|Apr precipitation mm = 82.2 | |||
|May precipitation mm = 81.2 | |||
|Jun precipitation mm = 87.0 | |||
|Jul precipitation mm = 89.3 | |||
|Aug precipitation mm = 94.1 | |||
|Sep precipitation mm = 83.1 | |||
|Oct precipitation mm = 91.3 | |||
|Nov precipitation mm = 96.4 | |||
|Dec precipitation mm = 86.8 | |||
|year precipitation mm = 1000.3 | |||
|rain colour = green | |||
|Jan rain mm = 27.3 | |||
|Feb rain mm = 20.9 | |||
|Mar rain mm = 29.7 | |||
|Apr rain mm = 67.7 | |||
|May rain mm = 81.2 | |||
|Jun rain mm = 87.0 | |||
|Jul rain mm = 89.3 | |||
|Aug rain mm = 94.1 | |||
|Sep rain mm = 83.1 | |||
|Oct rain mm = 89.1 | |||
|Nov rain mm = 76.7 | |||
|Dec rain mm = 38.8 | |||
|year rain mm = 784.9 | |||
|snow colour = green | |||
|Jan snow cm = 49.5 | |||
|Feb snow cm = 41.2 | |||
|Mar snow cm = 36.2 | |||
|Apr snow cm = 12.9 | |||
|May snow cm = 0.0 | |||
|Jun snow cm = 0.0 | |||
|Jul snow cm = 0.0 | |||
|Aug snow cm = 0.0 | |||
|Sep snow cm = 0.0 | |||
|Oct snow cm = 1.8 | |||
|Nov snow cm = 19.0 | |||
|Dec snow cm = 48.9 | |||
|year snow cm = 209.5 | |||
}} | |||
==Government== | ==Government== | ||
==Demographics== | ==Demographics== | ||
Revision as of 23:46, 12 August 2023
City Municipality of Fyedor
Vial-Gomil á Fyedor (Wilsk) Vila-Komyn á Fjedor (Seketese) | |
|---|---|
City Municipality | |
|
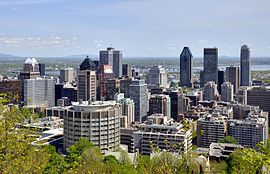
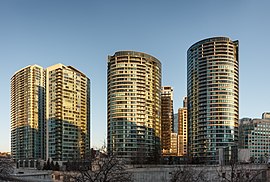
From top, clockwise: Downtown Fyedor, Church of St.Ality, Clocktower at Fyedor City Hall, Condos in midtown Fyedor. | |
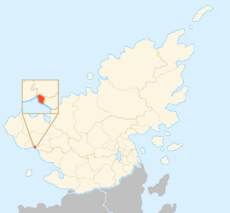
 Location of the City Municipality of Fyedor | |
| Country | |
| Province | |
| Government | |
| • Mayor | Maryh Gjaerdor (SY) |
| Area | |
| • City Municipality | 51 km2 (20 sq mi) |
| Population | 402,872 |
| • Density | 7,954.9/km2 (20,603/sq mi) |
| • Metro | 720,371 |
| • Summer (DST) | UTC= |
| Website | Fyedor.sek |
Fyedor (Wilsk: Fyedor; Seketese: Fjedor), officially the City Municipality of Fyedor (Wilsk: Vial-Gomil á Fyedor) is a city municipality the Seketese province of Wilsk. Located on the Aþenyor river valley along to southern Wilsk coastline, the municipality is the anchor of the Greater Fyedor Area. With a population of 402,872, it is the largest city in Wilskland and the 4th largest in Seketan. It is the largest non-Seketese city in Seketan, with 63% of its population being ethnically Wilsk, and a further 75% speaking Wilsk as their primary language, though it is also the most bilingual in Wilskland, with 68% speaking both Seketese and Wilsk.
The city was founded in 1242 as a trading outpost for wool within the then Szeye trade system, the town is one of the oldest in the Nelborne, with its oldtown being a UNESCO World Heritage Site. Local aristocracy would expand the towns power over the next century to form what would become known as the Ducky and later Kingdom of Wilskland. In modern times the city remains the political and cultural capital of Wilskland. In 2012 the city hosted the quinquennial Nelborne Games.
Today Fyedor is a major tourism hotspot in the Nelborne, with over 1 million annual tourists.
Etymology
The exact origins of the name "Fyedor" is unknown, especially given its popularity as both male first names and town names in Seketan and Wilskland. The city was first documented under that name in a 1332 trade map, though other contemporary names included Þampa, Cálat, and Necipai. During the early days of trade map making, it was not uncommon to label trade ports with the name of a local customs or trade officer, and it is currently suspected that given the commoness of Fyedor as a Wilsk first name, it was just adopted as the name of the town after many customs officers named such.
History
Origins
Middle Ages
Early Modern
Today
Geography
Neighbourhoods
Climate
| Climate data for Fyedor (Henri Þapmann International Airport) 1981−2010 normals, extremes 1941−present | |||||||||||||
|---|---|---|---|---|---|---|---|---|---|---|---|---|---|
| Month | Jan | Feb | Mar | Apr | May | Jun | Jul | Aug | Sep | Oct | Nov | Dec | Year |
| Record high Humidex | 13.5 | 14.7 | 28.0 | 33.8 | 40.9 | 45.0 | 45.8 | 46.8 | 42.8 | 33.5 | 26.2 | 18.1 | 46.8 |
| Record high °C (°F) | 13.9 (57.0) |
15.0 (59.0) |
25.8 (78.4) |
30.0 (86.0) |
36.6 (97.9) |
35.0 (95.0) |
35.6 (96.1) |
37.6 (99.7) |
33.5 (92.3) |
28.3 (82.9) |
24.3 (75.7) |
18.0 (64.4) |
37.6 (99.7) |
| Average high °C (°F) | −5.3 (22.5) |
−3.2 (26.2) |
2.5 (36.5) |
11.6 (52.9) |
18.9 (66.0) |
23.9 (75.0) |
26.3 (79.3) |
25.3 (77.5) |
20.6 (69.1) |
13.0 (55.4) |
5.9 (42.6) |
−1.4 (29.5) |
11.5 (52.7) |
| Daily mean °C (°F) | −9.7 (14.5) |
−7.7 (18.1) |
−2 (28) |
6.4 (43.5) |
13.4 (56.1) |
18.6 (65.5) |
21.2 (70.2) |
20.1 (68.2) |
15.5 (59.9) |
8.5 (47.3) |
2.1 (35.8) |
−5.4 (22.3) |
6.8 (44.2) |
| Average low °C (°F) | −14.0 (6.8) |
−12.2 (10.0) |
−6.5 (20.3) |
1.2 (34.2) |
7.9 (46.2) |
13.2 (55.8) |
16.1 (61.0) |
14.8 (58.6) |
10.3 (50.5) |
3.9 (39.0) |
−1.7 (28.9) |
−9.3 (15.3) |
2.0 (35.6) |
| Record low °C (°F) | −37.8 (−36.0) |
−33.9 (−29.0) |
−29.4 (−20.9) |
−15.0 (5.0) |
−4.4 (24.1) |
0.0 (32.0) |
6.1 (43.0) |
3.3 (37.9) |
−2.2 (28.0) |
−7.2 (19.0) |
−19.4 (−2.9) |
−32.4 (−26.3) |
−37.8 (−36.0) |
| Record low wind chill | −49.1 | −46.0 | −42.9 | −26.3 | −9.9 | 0.0 | 0.0 | 0.0 | −4.8 | −10.9 | −30.7 | −46.0 | −49.1 |
| Average precipitation mm (inches) | 77.2 (3.04) |
62.7 (2.47) |
69.1 (2.72) |
82.2 (3.24) |
81.2 (3.20) |
87.0 (3.43) |
89.3 (3.52) |
94.1 (3.70) |
83.1 (3.27) |
91.3 (3.59) |
96.4 (3.80) |
86.8 (3.42) |
1,000.3 (39.38) |
| Average rainfall mm (inches) | 27.3 (1.07) |
20.9 (0.82) |
29.7 (1.17) |
67.7 (2.67) |
81.2 (3.20) |
87.0 (3.43) |
89.3 (3.52) |
94.1 (3.70) |
83.1 (3.27) |
89.1 (3.51) |
76.7 (3.02) |
38.8 (1.53) |
784.9 (30.90) |
| Average snowfall cm (inches) | 49.5 (19.5) |
41.2 (16.2) |
36.2 (14.3) |
12.9 (5.1) |
0.0 (0.0) |
0.0 (0.0) |
0.0 (0.0) |
0.0 (0.0) |
0.0 (0.0) |
1.8 (0.7) |
19.0 (7.5) |
48.9 (19.3) |
209.5 (82.5) |


