This is a list of countries by gross domestic product (GDP) sector composition.
By economic sector
List of countries by percentage of employment
GDP from natural resources
Oil and natural gas
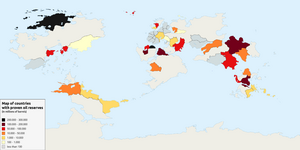
Map of proven oil reserves in barrels per country
Other fossil fuels and minerals
GDP from industry
| Nation |
Total from industry (% of GDP) |
Ferrus metallurgy (% of GDP) |
Non-ferrus metallurgy (% of GDP) |
Heavy industry (% of GDP) |
Chemical industry (% of GDP) |
Oil and gas industry (% of GDP) |
Timber and woodworking industry (% of GDP) |
Building materials industry (% of GDP) |
Light industry (% of GDP) |
Food industry (% of GDP)
|
| Arabekh
|
 Hafar Hafar
|
49.6
|
1.1
|
2.9
|
10.6
|
3.9
|
25.2
|
0.2
|
1.6
|
3.1
|
1.0
|
| Asura
|
| Catai
|
| Savai
|
| Majula
|
| Rennekka
|
| Vestrim
|
See also
