Demographics of Mustelaria
This text is non-canon because it was either retconned, the lore was changed, or the countries listed in this article no longer exist. Please comment on this article's talk page to share your input, comments and questions. Note: Linking this article might complicate your own worldbuilding. |
This article is incomplete because it is pending further input from participants, or it is a work-in-progress by one author. Please comment on this article's talk page to share your input, comments and questions. Note: To contribute to this article, you may need to seek help from the author(s) of this page. |
| Subdivisions of Mustelaria |
|---|
|
The demographics of Mustelaria include linguistics, where zonal constructed language named Neo-Mustelarian, which is de jure the official Lingua franca, Zhoushi, which is the Lingua franca in Zhousheng and Belgorian, which is the Lingua franca in Monte Blanco.
Many local minority languages are also in official use on local level and are recognized as official languages of their respective areas
Language distribution
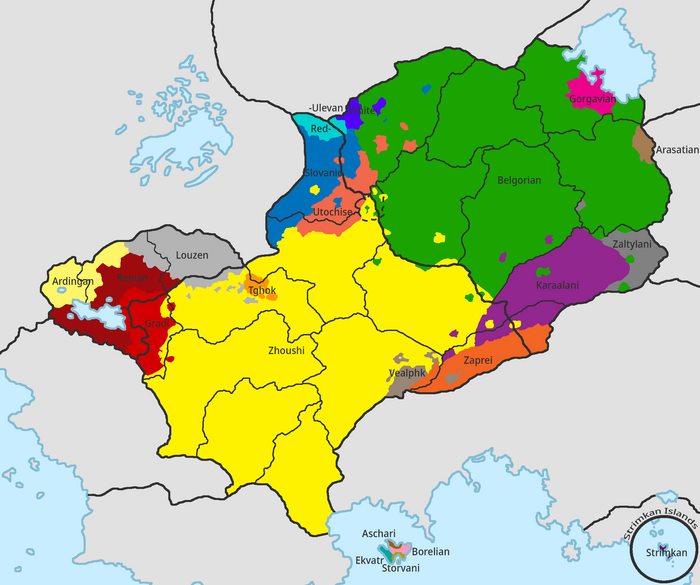
Mustelaria officially recognizes 13 nationalities as a "national nationalities", which are officially not a minority, but are recognized as a nationalities, which have somewhere in Mustelaria an area, where they are a majority or plurality.[1] Those nationalities are defined as "...being either more than 15 million people spread across Mustelaria or being more than half a million inhabitants localized in a certain area, where they have to be a plurality, or where there is their homeland and their ethnicity has the biggest concentration in Anteria...", however, nationalities are "...defined by people themselves and are not associated to a language, but the a internal feeling of each individual...", so the national identity is tied to a feeling rather than to a cultural or linguistic base, although people are encouraged by official documents to consider the language they speak.
| Languages of Mustelaria | |
|---|---|
| Official | Neo-Mustelarian (Z.C.L.) Zhoushi (Zhousheng) Belgorian (Monte Blanco) |
| Regional | Aschari, Borelian, Gradi, Gorgavian, Karaalan, Louzen, Neuew, Phnom, Preimeai, Slovanic, Storvani, Ulevan, Velpan, Tghok |
| Minority | Gadori, Arasatian, Bakyernian, Qazhshavan, Kental, Scouse |
| Foreign | Common (83%) Gadori (56%) Neuew (32%) Preimeai (21%) Kental (17%) Qazhshavan (11%) Scouse (4%) |
| Signed | Polyashi Sign Language |
| Keyboard layout | |
| Ethnic distribution of Mustelaria | |||
|---|---|---|---|
| Graph of the distribution: | |||
| Color | Nationality | Language family | Population (in Mustelaria) |
| Zhoushi (Bogmian, Zhengian) | Slavic | 121 Million | |
| Belgorian | 108 Million | ||
| Slovanic | 19 Million | ||
| Karaalani | 18 Million | ||
| Gorgavian | 4 Million | ||
| Louzen (Haldenian) | 2 Million | ||
| Arasatian | 1 Million | ||
| Velpan | 1 Million | ||
| Ulevan | 1 Million | ||
| Storvani | 0.5 Million | ||
| Zaprei | Prei-Phnom | 9 Million[2]
| |
| Preimeai | |||
| Phná | |||
| Aschari | 0.7 Million | ||
| Gradi | Germanic | 6 Million | |
| Borelian | Bornese | 0.6 Million | |
| Tghok | Mokhaic | 0.5 Million | |
| Neuew, Agarn | Sivuk | 0.5 Million | |
Religious distribution
TBA
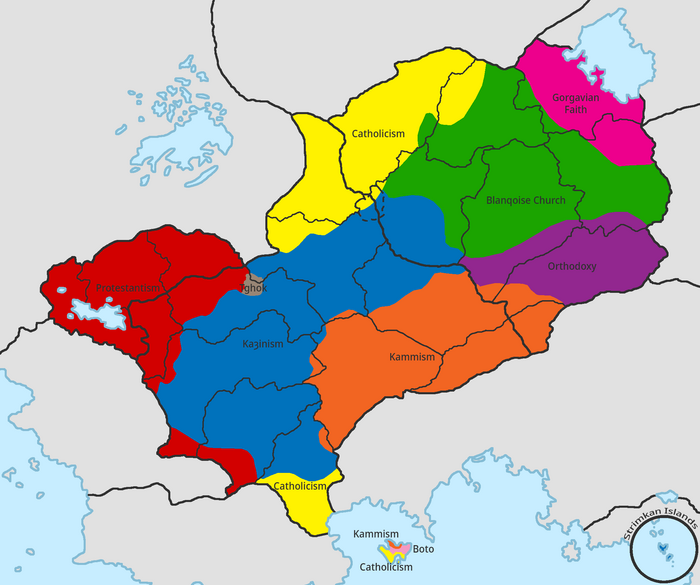
| Religious distribution of Mustelaria (Irreligion is not shown on the map) | |||
|---|---|---|---|
| Graph of the distribution: | |||
Belief in Mustelaria Kaȝinism (19.7%) Kammism (17.6%) Blanqoise Church (13.9%) Catholicism (10.9%) Protestantism (7.7%) Orthodoxy (6%) Gorgavian faith (2.1%) Boto Faith (0.2%) Tghok faith (0.2%) Connection faiths (0.2%)
| |||
| Color | Religion | Group | Population (in Mustelaria) |
| Kaȝinism | Christianity | 65 Million | |
| Blanqoise Church | 50 Million | ||
| Catholicism | 31 Million | ||
| Protestantism | 22 Million | ||
| Orthodoxy | 17 Million | ||
| Kammism | 56 Million | ||
| Gorgavian faith | Local faiths | 6 Million | |
| Boto faith | 0.6 Million | ||
| Tghok faith | 0.4 Million | ||
| Connection faiths (No majority area) | 0.5 Million | ||
Development of population
| Historical populations | |||||||||||||||||||||||||||||||||||||||||||||||||||||||||||||||||||||||||||||||
|---|---|---|---|---|---|---|---|---|---|---|---|---|---|---|---|---|---|---|---|---|---|---|---|---|---|---|---|---|---|---|---|---|---|---|---|---|---|---|---|---|---|---|---|---|---|---|---|---|---|---|---|---|---|---|---|---|---|---|---|---|---|---|---|---|---|---|---|---|---|---|---|---|---|---|---|---|---|---|---|
|
| ||||||||||||||||||||||||||||||||||||||||||||||||||||||||||||||||||||||||||||||
| 1 First ever official nation-wide census 2 First immigrational wave due to the breakup of the Empire of Three Kings 3 Second immigrational wave, from Qazhshava 4 Dip due to the War of the Council 5 Third immigrational wave, from Prei Meas 6 Immigrational wave from occupied Velharia 7 Estimate for present | |||||||||||||||||||||||||||||||||||||||||||||||||||||||||||||||||||||||||||||||
<graph>{"legends":[{"properties":{"title":{"fill":{"value":"#54595d"}},"labels":{"fill":{"value":"#54595d"}}},"stroke":"color","title":"Legend","fill":"color"}],"scales":[{"type":"linear","name":"x","domain":{"data":"chart","field":"x"},"zero":false,"range":"width","nice":true},{"type":"linear","name":"y","domain":{"data":"chart","field":"y"},"zero":true,"range":"height","nice":true},{"domain":{"data":"chart","field":"series"},"type":"ordinal","name":"color","range":["darkturquoise","darkcyan","aqua"]}],"version":2,"marks":[{"type":"group","marks":[{"properties":{"hover":{"fill":{"value":"red"}},"update":{"fill":{"scale":"color","field":"series"}},"enter":{"y":{"scale":"y","field":"y"},"interpolate":{"value":""},"y2":{"scale":"y","value":0},"x":{"scale":"x","field":"x"},"fill":{"scale":"color","field":"series"}}},"type":"area"}],"from":{"data":"chart","transform":[{"groupby":["series"],"type":"facet"}]}}],"height":250,"axes":[{"type":"x","title":"Year (Anno Domini)","scale":"x","format":"d","properties":{"title":{"fill":{"value":"#54595d"}},"grid":{"stroke":{"value":"#54595d"}},"ticks":{"stroke":{"value":"#54595d"}},"axis":{"strokeWidth":{"value":2},"stroke":{"value":"#54595d"}},"labels":{"fill":{"value":"#54595d"}}},"grid":false},{"type":"y","title":"Population (in Millions)","scale":"y","format":"d","properties":{"title":{"fill":{"value":"#54595d"}},"grid":{"stroke":{"value":"#54595d"}},"ticks":{"stroke":{"value":"#54595d"}},"axis":{"strokeWidth":{"value":2},"stroke":{"value":"#54595d"}},"labels":{"fill":{"value":"#54595d"}}},"grid":false}],"data":[{"format":{"parse":{"y":"integer","x":"integer"},"type":"json"},"name":"chart","values":[{"y":4,"series":"Historic estimate","x":900},{"y":5,"series":"Historic estimate","x":950},{"y":6,"series":"Historic estimate","x":1000},{"y":6,"series":"Historic estimate","x":1050},{"y":7,"series":"Historic estimate","x":1100},{"y":8,"series":"Historic estimate","x":1150},{"y":9,"series":"Historic estimate","x":1200},{"y":9,"series":"Historic estimate","x":1250},{"y":10,"series":"Historic estimate","x":1290},{"y":11,"series":"Historic estimate","x":1310},{"y":12,"series":"Historic estimate","x":1330},{"y":13,"series":"Historic estimate","x":1350},{"y":15,"series":"Historic estimate","x":1370},{"y":17,"series":"Historic estimate","x":1390},{"y":20,"series":"Historic estimate","x":1410},{"y":23,"series":"Historic estimate","x":1430},{"y":26,"series":"Historic estimate","x":1450},{"y":30,"series":"Historic estimate","x":1470},{"y":34,"series":"Historic estimate","x":1490},{"y":36,"series":"Historic estimate","x":1510},{"y":37,"series":"Historic estimate","x":1530},{"y":35,"series":"Historic estimate","x":1550},{"y":31,"series":"Historic estimate","x":1570},{"y":30,"series":"Historic estimate","x":1590},{"y":35,"series":"Historic estimate","x":1610},{"y":37,"series":"Historic estimate","x":1630},{"y":40,"series":"Historic estimate","x":1650},{"y":45,"series":"Historic estimate","x":1670},{"y":50,"series":"Historic estimate","x":1690},{"y":57,"series":"Historic estimate","x":1710},{"y":64,"series":"Historic estimate","x":1730},{"y":69,"series":"Historic estimate","x":1750},{"y":76,"series":"Historic estimate","x":1770},{"y":84,"series":"Historic estimate","x":1790},{"y":95,"series":"Historic estimate","x":1810},{"y":113,"series":"Historic estimate","x":1830},{"y":127,"series":"Historic estimate","x":1850},{"y":145,"series":"Historic estimate","x":1870},{"y":145,"series":"Census data","x":1870},{"y":167,"series":"Census data","x":1890},{"y":181,"series":"Census data","x":1910},{"y":212,"series":"Census data","x":1930},{"y":210,"series":"Census data","x":1950},{"y":230,"series":"Census data","x":1970},{"y":241,"series":"Census data","x":1990},{"y":250,"series":"Census data","x":2010},{"y":241,"series":"Census data","x":2020},{"y":241,"series":"Future estimate","x":2020},{"y":235,"series":"Future estimate","x":2030},{"y":228,"series":"Future estimate","x":2050},{"y":220,"series":"Future estimate","x":2070},{"y":211,"series":"Future estimate","x":2090},{"y":203,"series":"Future estimate","x":2100}]}],"width":700}</graph> TBA
- ↑ Ulevans are given their position as they are a notable plurality in many Slovanic areas and their numbers are probably higher as they mostly identify themselves as Ulevan-speaking Slovans. Neuews are given the status based on a treaty with Neuewland, which gave Storvan to Zhousheng
- ↑ Laws set by the autonomous constitution of the Zaprei Autonomy prohibits division of the Prei-Phnom nationalities on census ballots into Zaprei, Preimeai and Phná, as that could bias autonomous leaders. It is generally expected, that the biggest representation is Zaprei with the second biggest being Phná

