Geography of Roqoo: Difference between revisions
m (→Climate) |
|||
| Line 38: | Line 38: | ||
=== Climate === | === Climate === | ||
Latitude and altitude are the principal influences on the climate of Roqoo. As it stretches from central to northern Alharu Roqoo experiences four distinct seasons. Only in the south is summer slightly longer than the other seasons. On the average, each season lasts almost exactly 3 months. | |||
The Ygros Sea to the north interacts with the Alharu continet to modify the climate of the country, forming milder temperatures and less severe changes the farther north in the country one travels. Conversely, northerly winds from the Paran desert in central Alharu warm the southern region. These winds interacting with the low pressure systems of Chenshas Lake can cause severe winters and high temperatures in the summer. | |||
The highest ever recorded temperature is 37.8 °C (100 °F) (Navala, 13 SEL 2013 (26 Jul 2013)). The lowest, -42.3 °C (-46 °F)(Forssa, 25 TOV 1987 (25 Jan 1987). The annual mid temperature is relatively high in the southern region (5.0 to 7.5 °C or 41.0 to 45.5 °F), with mild winters and hot summers; yet lower in central through northern regions (-1 to 4 °C or 33.8 to 39.2 °F). | |||
{{Weather box|width=80% | |||
|location = Roqoo | |||
|metric first = Yes | |||
|single line = Yes | |||
|Jan high C = -0.9 | |||
|Feb high C = -1.1 | |||
|Mar high C = 2.7 | |||
|Apr high C = 9.5 | |||
|May high C = 15.6 | |||
|Jun high C = 19.4 | |||
|Jul high C = 22.4 | |||
|Aug high C = 21.3 | |||
|Sep high C = 16.2 | |||
|Oct high C = 9.6 | |||
|Nov high C = 4.1 | |||
|Dec high C = 1.0 | |||
|year high C = 10.0 | |||
|Jan low C = -5.6 | |||
|Feb low C = -6.5 | |||
|Mar low C = -3.9 | |||
|Apr low C = 0.9 | |||
|May low C = 5.6 | |||
|Jun low C = 10.2 | |||
|Jul low C = 13.2 | |||
|Aug low C = 12.5 | |||
|Sep low C = 8.6 | |||
|Oct low C = 3.9 | |||
|Nov low C = 0.0 | |||
|Dec low C = -3.1 | |||
|year low C = 3.0 | |||
|precipitation colour = green | |||
|Jan precipitation mm = 49 | |||
|Feb precipitation mm = 39 | |||
|Mar precipitation mm = 35 | |||
|Apr precipitation mm = 34 | |||
|May precipitation mm = 42 | |||
|Jun precipitation mm = 70 | |||
|Jul precipitation mm = 67 | |||
|Aug precipitation mm = 81 | |||
|Sep precipitation mm = 58 | |||
|Oct precipitation mm = 72 | |||
|Nov precipitation mm = 61 | |||
|Dec precipitation mm = 53 | |||
|year precipitation mm = 662 | |||
|source 1 = | |||
|date= 2023 Tova 05 | |||
}} | |||
====Coastal==== | ====Coastal==== | ||
| Line 95: | Line 148: | ||
| clear=none | | clear=none | ||
}} | }} | ||
{{Eurth}} | {{Eurth}} | ||
[[Category:Roqoo]] | [[Category:Roqoo]] | ||
Revision as of 01:42, 6 January 2023
| Continent | Alharu |
|---|---|
| Region | North-central Alharu |
| Area | |
| • Total | 325,020 km2 (125,490 sq mi) |
| • Land | 97%% |
| • Water | Expression error: Unrecognized punctuation character "%".% |
| Coastline | 127 km (79 mi) |
| Highest point | Korkein Point, Eastern Highlands 1,119 m |
| Lowest point | Asmaru Bay 0 m |
| Longest river | Suuri |
| Largest lake | Maamme sisameri |
| Climate | Varied; Warm continental and Oceanic climate throughout |
| Terrain | mainly flat, narrow valley in north extending to broad low valley in south. Bordered by "highlands" on east and west. |
| Natural Resources | Various marine life and mineral resources in territorial waters, large deposits of iron ore, rare metals, natural gas, minerals, and timber stills on land. |
| Natural Hazards | eurthquakes, landslides, and sandstorms particularly in southern Roqoo |
| Environmental Issues | deforestation; overfishing; desertification; endangered wildlife |
Roqoo is a country in North-Central Alharu stretching along the low Avaara valley of the Suuri river, which connects Chenshas Lake, an inland sea and largest freshwater lake on Eurth, in the south, to Asmaru Bay on the Ygros Sea in the north. Roqoo is bordered by Alharic highlands to the east and west. At 325,620 km2 (125,700 sq mi), Roqoo is the seventh largest nation in Alharu. Roqoo has a short 127 km coastline in the north and a 426 km shoreline on theAitivedet arm (lit: "mother waters) of Chenshas Lake in the south. It claims a small Exclusive Economic Zone of 40,386 km2 (15,593 sq mi).
Terrain
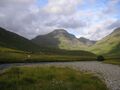
Korkein Point, the highest point in the nation at 1,119 m (3,671 ft).
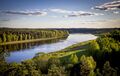
The Suuri river in south-central Roqoo.


Natural Resources
Environment
Climate
Latitude and altitude are the principal influences on the climate of Roqoo. As it stretches from central to northern Alharu Roqoo experiences four distinct seasons. Only in the south is summer slightly longer than the other seasons. On the average, each season lasts almost exactly 3 months.
The Ygros Sea to the north interacts with the Alharu continet to modify the climate of the country, forming milder temperatures and less severe changes the farther north in the country one travels. Conversely, northerly winds from the Paran desert in central Alharu warm the southern region. These winds interacting with the low pressure systems of Chenshas Lake can cause severe winters and high temperatures in the summer.
The highest ever recorded temperature is 37.8 °C (100 °F) (Navala, 13 SEL 2013 (26 Jul 2013)). The lowest, -42.3 °C (-46 °F)(Forssa, 25 TOV 1987 (25 Jan 1987). The annual mid temperature is relatively high in the southern region (5.0 to 7.5 °C or 41.0 to 45.5 °F), with mild winters and hot summers; yet lower in central through northern regions (-1 to 4 °C or 33.8 to 39.2 °F).
| Climate data for Roqoo | |||||||||||||
|---|---|---|---|---|---|---|---|---|---|---|---|---|---|
| Month | Jan | Feb | Mar | Apr | May | Jun | Jul | Aug | Sep | Oct | Nov | Dec | Year |
| Average high °C (°F) | −0.9 (30.4) |
−1.1 (30.0) |
2.7 (36.9) |
9.5 (49.1) |
15.6 (60.1) |
19.4 (66.9) |
22.4 (72.3) |
21.3 (70.3) |
16.2 (61.2) |
9.6 (49.3) |
4.1 (39.4) |
1.0 (33.8) |
10.0 (50.0) |
| Average low °C (°F) | −5.6 (21.9) |
−6.5 (20.3) |
−3.9 (25.0) |
0.9 (33.6) |
5.6 (42.1) |
10.2 (50.4) |
13.2 (55.8) |
12.5 (54.5) |
8.6 (47.5) |
3.9 (39.0) |
0.0 (32.0) |
−3.1 (26.4) |
3.0 (37.4) |
| Average precipitation mm (inches) | 49 (1.9) |
39 (1.5) |
35 (1.4) |
34 (1.3) |
42 (1.7) |
70 (2.8) |
67 (2.6) |
81 (3.2) |
58 (2.3) |
72 (2.8) |
61 (2.4) |
53 (2.1) |
661 (26) |
Coastal
| Nime | ||||||||||||||||||||||||||||||||||||||||||||||||||||||||||||
|---|---|---|---|---|---|---|---|---|---|---|---|---|---|---|---|---|---|---|---|---|---|---|---|---|---|---|---|---|---|---|---|---|---|---|---|---|---|---|---|---|---|---|---|---|---|---|---|---|---|---|---|---|---|---|---|---|---|---|---|---|
| Climate chart (explanation) | ||||||||||||||||||||||||||||||||||||||||||||||||||||||||||||
| ||||||||||||||||||||||||||||||||||||||||||||||||||||||||||||
| ||||||||||||||||||||||||||||||||||||||||||||||||||||||||||||
Central lowlands
| Bellamy | ||||||||||||||||||||||||||||||||||||||||||||||||||||||||||||
|---|---|---|---|---|---|---|---|---|---|---|---|---|---|---|---|---|---|---|---|---|---|---|---|---|---|---|---|---|---|---|---|---|---|---|---|---|---|---|---|---|---|---|---|---|---|---|---|---|---|---|---|---|---|---|---|---|---|---|---|---|
| Climate chart (explanation) | ||||||||||||||||||||||||||||||||||||||||||||||||||||||||||||
| ||||||||||||||||||||||||||||||||||||||||||||||||||||||||||||
| ||||||||||||||||||||||||||||||||||||||||||||||||||||||||||||
Southern
| Navala | ||||||||||||||||||||||||||||||||||||||||||||||||||||||||||||
|---|---|---|---|---|---|---|---|---|---|---|---|---|---|---|---|---|---|---|---|---|---|---|---|---|---|---|---|---|---|---|---|---|---|---|---|---|---|---|---|---|---|---|---|---|---|---|---|---|---|---|---|---|---|---|---|---|---|---|---|---|
| Climate chart (explanation) | ||||||||||||||||||||||||||||||||||||||||||||||||||||||||||||
| ||||||||||||||||||||||||||||||||||||||||||||||||||||||||||||
| ||||||||||||||||||||||||||||||||||||||||||||||||||||||||||||